3 Best Swing Trading Strategies That Actually Work

By Sachin Malik
Most swing traders lose money.
Not because they aren’t committed but because they follow the wrong strategies.
They chase popular strategies that no longer work and keep watching their capital bleed, trade after trade.
In this article, I’ll show you 3 powerful swing trading strategies that actually work and the popular traps you must avoid.
Table of Contents
Toggle1. Understanding Swing Trading
In this article, you’ll learn three of the most powerful swing trading strategies:
- VCC Setup
- Power Play Setup
- Long Range Breakout Setup
But before we dive in, let’s quickly understand what swing trading is all about.
If you’re in a hurry, you can directly jump to these swing trading strategies.
1.1 What is a Swing?
When a stock moves upward, it doesn’t rise in a straight line.
It moves in a zigzag pattern — rising, pulling back slightly, then rising again.
The distance between two such turning points is called a swing.
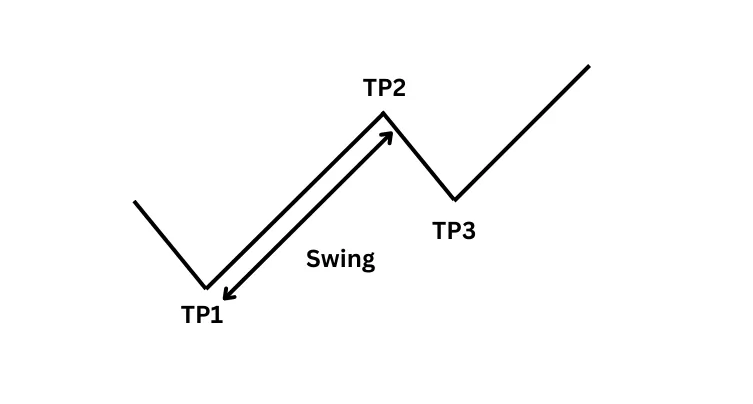
Think of it like taking two steps forward and one step back — each swing is part of the stock’s natural rhythm as it climbs.
For example, the move from Turning Point 1 (TP1) to Turning Point 2 (TP2) is one complete swing.
1.2 What is Swing Trading?
Swing trading is the art of capturing a swing.
You buy when a new swing has started and you sell when the swing is complete.
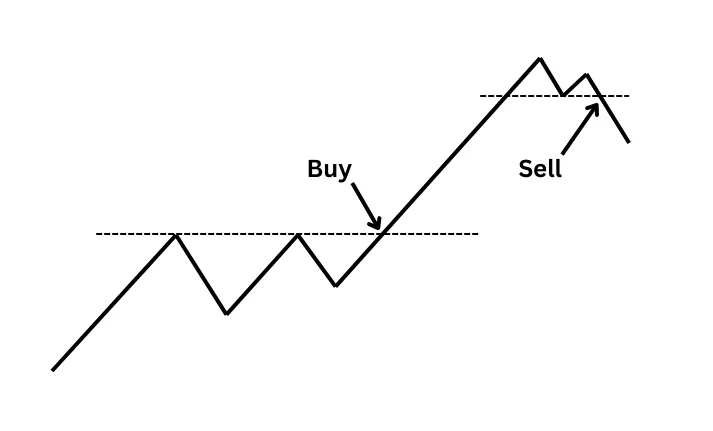
For example, you buy when the stock breaks out of a range and begins to move up.
You ride the entire swing, and once it is complete, you sell it.
1.3 Why is it called Swing Trading?
It is called swing trading because you’re trying to capture just one swing.
Not two.
Not three.
Just one clean, simple swing.
1.4 Pros and Cons of Swing Trading
Here are some key advantages and disadvantages of swing trading:
Pros of Swing Trading
1. Freedom from the screen
You don’t have to be glued to your screen all day. You can place a trade, step away, and let the market do the heavy lifting.
2. Time flexibility
You’ll have more time to focus on your job or business without constantly watching the market.
3. Lower stress
Watching prices tick up and down every second creates mental pressure. Swing trading keeps you stress-free — as long as you’re following the right process.
Cons of Swing Trading
1. Patience is a must
You may not get a setup for days or even weeks. You need to wait for the perfect shot.
If you’re impatient, swing trading isn’t for you.
2. Overnight risk
Since trades are held for days or weeks, there’s always a chance of overnight gaps due to news or global events.
You have to accept this risk — but with good risk management, it can be handled effectively.
1.5 Best Time Frame For Swing Trading
The best time frame for swing trading depends on your style.
A swing trade can last anywhere from a few days to a few weeks.
If you use the daily chart, your trades will typically last around 10 to 20 days. If you use the weekly chart, your trades might last 10 to 20 weeks.
Both time frames have their own pros and cons.
Many traders combine the two — using weekly charts for direction and daily charts for entry.
But here’s a general rule that always holds true: the longer your holding period, the easier it becomes to make money.
When a beginner enters the stock market, they often think, “I’ll buy a stock, hold it for a few hours, and become a crorepati.”
I thought that too.
I started with intraday trading and spent two years there, but I couldn’t make money.
Then I switched to swing trading using daily charts. I was holding trades for a few days.
I still wasn’t making money, but I wasn’t losing either — thanks to good risk management and position sizing.
But there was a problem.
When the market went up, all my stocks went up.
When it turned down, all my stop losses got hit.
I was stuck — just breaking even.
That’s when I decided to go higher.
I shifted to weekly charts, and everything changed. My trades became more relaxed. My signals were cleaner. I started making consistent profits.
Why?
Because higher time frames give more reliable signals. You get more real breakouts and fewer fakeouts.
Your life becomes easier when you trade with the bigger picture.
But that’s my journey.
You get to choose what works best for you.
In the strategies I’ll share next, I’ve used weekly charts, but you can apply them to daily charts as well.
Choose the time frame that fits your personality and lifestyle.
• The higher the time frame, the cleaner the signal — and the calmer the trader.
2. Top 3 Swing Trading Strategies That Actually Make Money
Now it’s time to learn the swing trading strategies that actually work in the real market. These are time-tested, proven setups — and I’ve used them myself.
They worked in the past.
They work right now.
And they’ll keep working in the future.
Once you learn these strategies, you won’t need to waste time reading random articles or chasing flashy new systems. These are the real deal.
Before we dive deep into each one, here’s a quick overview:
1. VCC (Volatility Contraction Characteristic)
This setup shows a stock making smaller and smaller pullbacks before suddenly exploding upward. It’s a sign of strong accumulation by smart money.
2. Power Play Setup
Think of this like a jet gaining speed, then pausing for a quick refuel before taking off again. Momentum builds, pauses, then launches.
3. Long Range Breakout Setup
This setup is like a sleeping giant. The stock stays in a wide, quiet range for months — and then breaks out with power and follow-through.
Once you master these setups, your trading results will change dramatically.
Let’s break them down one by one.
• Ignore the noise. These are the setups worth betting on.
3. Swing Trading Strategy #1: Volatility Contraction Characteristics (VCC) Setup
VCC is a setup where volatility contracts with every pullback.
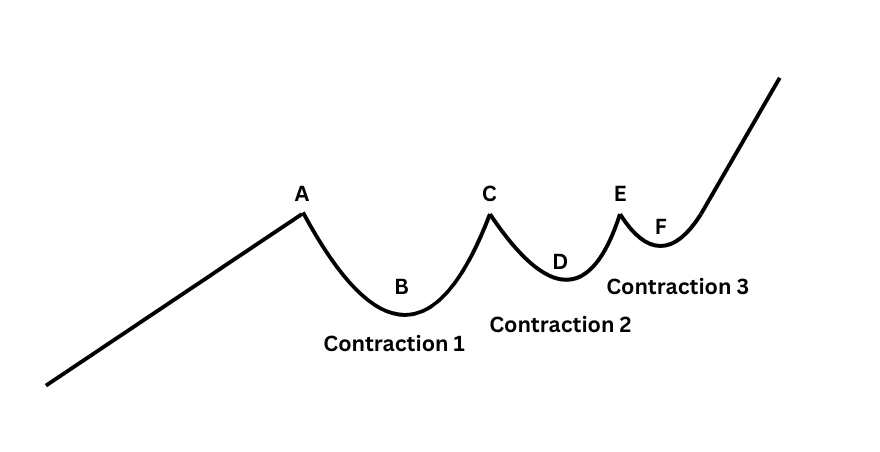
Let’s say a stock is trending up. From Point A, it pulls back to Point B — that’s the first contraction.
Then it rises again, almost touches the previous high, and pulls back. This time the pullback stops at Point D — which is higher than Point B.
That’s your second contraction — and it’s smaller than the first.
Volatility is shrinking.
Now the stock bounces again, but the next pullback ends at Point F — higher than the last one.
That’s the third contraction. And it’s even smaller.
At this point, volatility is drying up fast.
This setup is called the volatility contraction characteristics setup — or VCC.
Each pullback gets tighter, and once the stock breaks out of the upper range, that’s your buy trigger.
The stock is ready to explode. Momentum usually follows.
3.1 Psychology Behind VCC
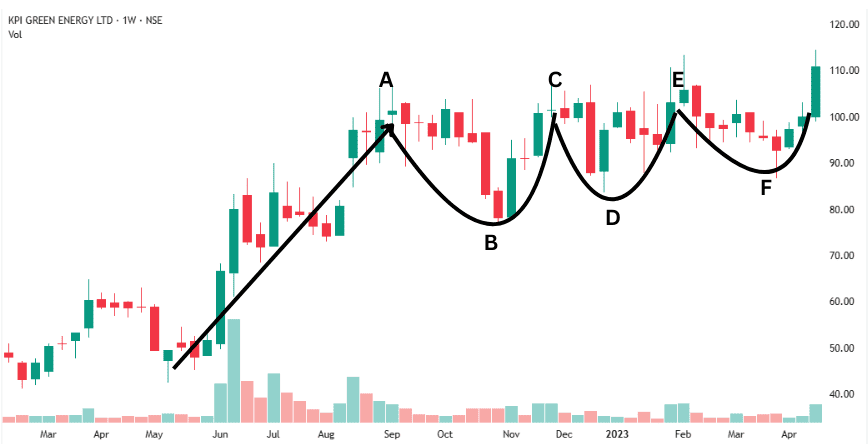
The stock is in a clear uptrend until it hits Point A and starts a pullback.
At Point B, buyers step in. They find the dip attractive and start accumulating.
The stock moves up to Point C, faces resistance, and starts another pullback.
But this time, before it even reaches the previous low, buyers jump in again.
That’s a key sign — buyers are getting aggressive. They don’t want to wait for lower prices. They’re in a hurry to accumulate.
Price goes back up to Point E and meets resistance again. Another pullback starts.
This time, the stock dips to Point F — still a higher low — and again, buyers step in early.
What does this tell you?
There’s urgency. Buyers know shares are limited. So they’re grabbing whatever they can — even at higher prices.
Each pullback gets smaller. Volatility keeps shrinking.
Now you’ve got a situation where demand is rising fast, but supply is tight.
And in markets, when demand is high and supply is low, there’s only one outcome — price goes up.
So when the breakout happens, it comes with volume. Buyers don’t want to miss out, so they’re willing to pay up.
The whole setup works because of quiet accumulation. Institutions keep buying until there’s no one left to sell. Then they push the price higher.
And when that kind of breakout happens, price usually doesn’t stop after a few points — it often runs hard.
3.2 How to Identify a VCC
To spot a VCC setup, just study the price action.
Start with the lows. If each pullback ends at a higher level than the last one, it means buyers are stepping in early.
Now look at the highs. If the stock keeps hitting a similar level at the top but doesn’t break out, it’s building pressure.
This narrowing range is a clear sign that the stock is getting tighter.
You don’t need any indicators. The chart itself tells you everything — shrinking pullbacks, higher lows, and flat resistance.
Once the price moves above that resistance, it often leads to a fast breakout — and that’s your swing trade entry.
3.3 Your Entry and Exit Point
Entry is simple: You enter when the stock breaks out of the range.
But before you get in, you must be clear about one thing — where you’ll get out if the trade goes wrong.
There are two ways to set your exit:
- Below the low of the breakout candle
- Below the low of the entire setup
Most books and courses teach the first one. But I’m telling you from experience — the second one is more reliable.
If you place your stop just below the breakout candle, you’ll often get shaken out by normal price movements.
The stock pulls back a little, hits your stop, and then flies up — while you’re left watching from the sidelines.
That’s why it’s better to place your exit below the low of the whole setup (below Point B).
If the price falls that far, it means the setup has failed — and then it makes sense to exit. Otherwise, give the trade some room to work.
That’s your plan: enter on the breakout, and exit only if the setup fails.
This way, you stay in the trade long enough to catch the full move — without getting shaken out too early.
That’s how you give your swing trades the room they need to deliver big results.
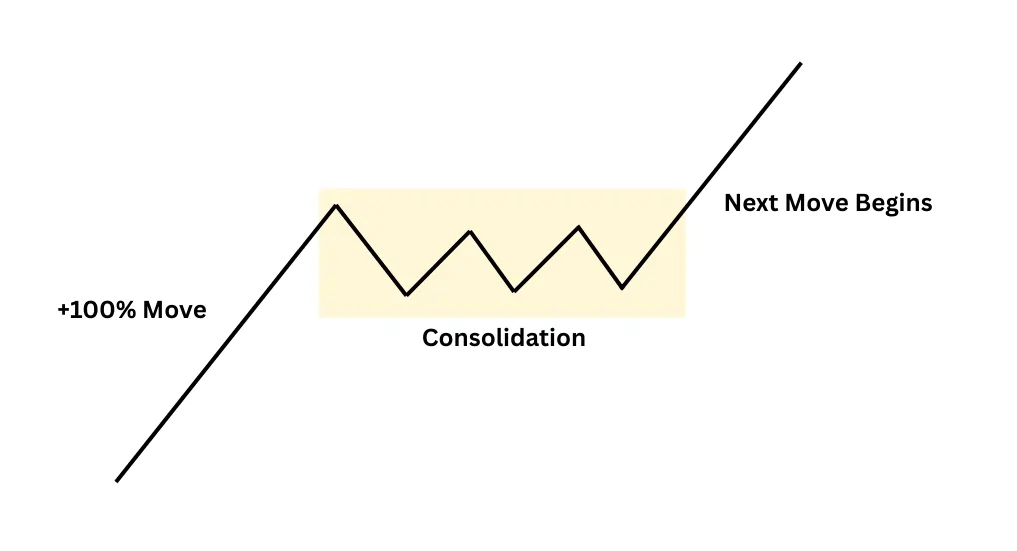
4. Swing Trading Strategy #2: Power Play Setup
Let’s say a stock doubles or triples in couple of months, price goes up in straight line without any major pullback.
Then it goes in the consolidation zone for some time.
Then it breaks out of this consolidation zone and now there is a very high probability that it will start going up again.
This setup is known as the Power Play Setup.
It is called power play setup because stock is displaying huge strength.
If the stock doubles or triples in a couple of months then it means there is a huge buying pressure behind this move.
Without a strong reason, a stock does not go up so fast in so little time.
Once it breaks out of the consolidation zone and there is a huge probability that it will continue its journey upward. This is your right time to get in.
4.1 Psychology Behind Power Play Setup
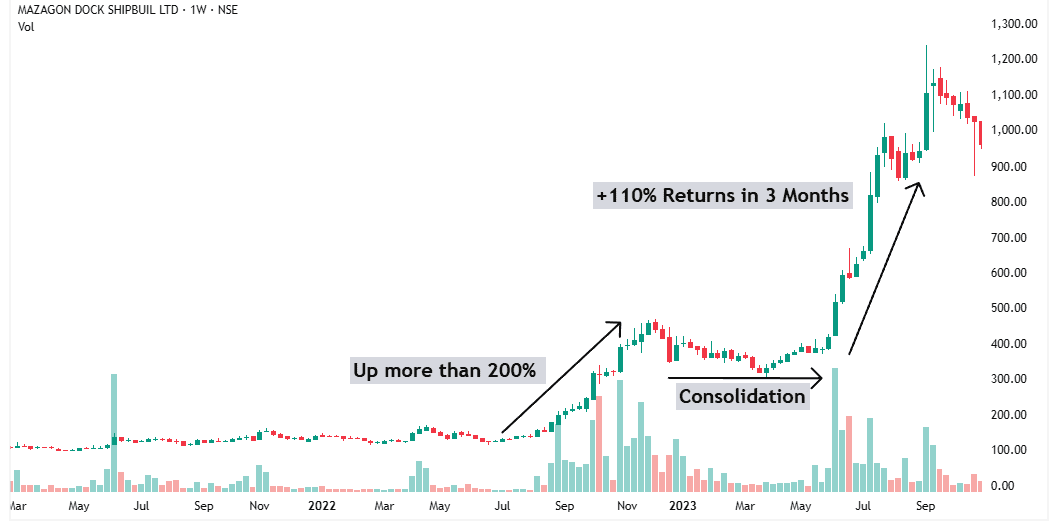
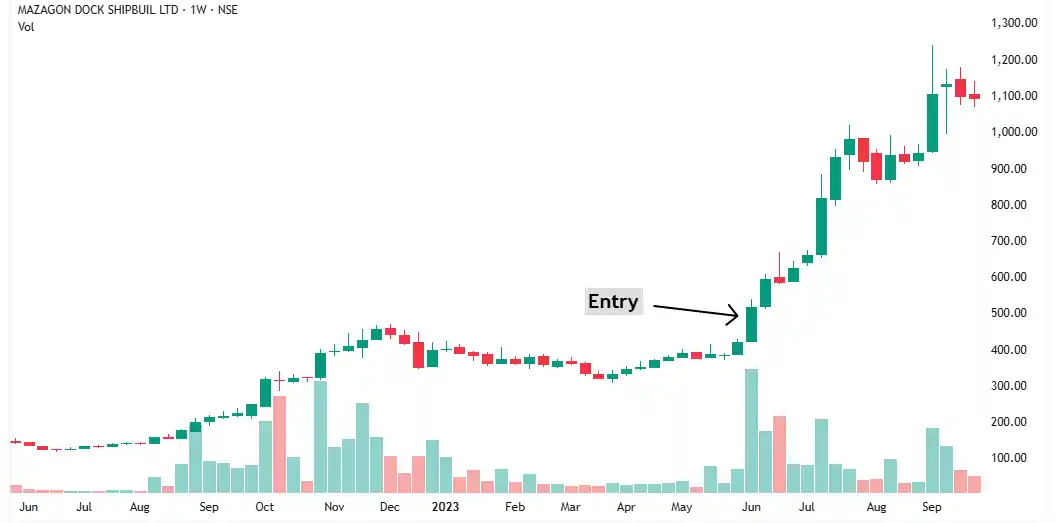
Mazdock went up more than 200% in a straight line. Just look at the volume behind that move.
That’s not your neighbour buying the stock. Your neighbour doesn’t have that kind of money.
Millions of shares were traded during that rally.
And when you see that kind of sudden price spike with massive volume, it means one thing: big institutions are buying.
And here’s the key — mutual funds, banks, or FIIs don’t buy based on technical analysis. They’re not swing traders. They’re buying based on deep fundamental conviction.
They believe the company’s earnings are going to grow. They expect strong performance in the future. And that’s why they’re building large positions today.
But here’s what most traders forget: Fundamentals don’t change overnight.
If a company is expected to do well, it doesn’t suddenly start doing badly after a few weeks. So when a stock goes up 100% or more in a short time, it often doesn’t stop there.
Yes, it takes a pause — usually a sideways consolidation. That’s normal. The stock is just digesting its gains.
Then the company delivers another strong quarter…
And the stock breaks out again and continues its journey.
That’s exactly what happened with Mazdock. After the first explosive move, it consolidated. Then it broke out — and went up another 100% in just 3 months.
One or two moves like that can make your whole year.
That’s the power of the Power Play setup.
4.2 How to Identify a Power Play Setup
Start with a stock that has already moved up 100% or more in a short time — with huge volume.
Then it goes sideways. It consolidates in a tight range.
During this phase, volume drops. That’s a sign: institutions are holding, not selling.
Once it breaks out of that range on high volume — that’s your Power Play setup.
4.3 Your Entry and Exit Point
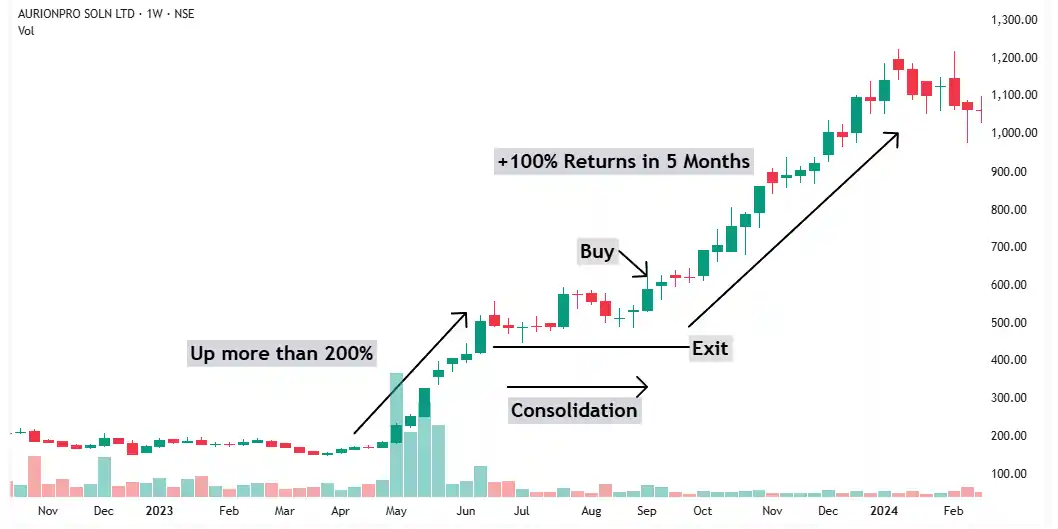
Your entry is simple: once the stock breaks out of consolidation, you buy.
Now again, there are two ways to set your exit:
- Below the low of the breakout candle
- Below the low of the entire setup
Most books recommend the first method. But I recommend the second — it’s safer and gives your trade more room to work.
This way, you protect your capital if the setup fails and give the trade enough space to play out if it works.
5. Swing Trading Strategy #3: Long Range Breakout Setup
Imagine a stock that has been sleeping for years—moving sideways with no real action.
No excitement.
No volatility.
Just pure boredom.
Now suddenly… it wakes up.
After more than 24 months of silence, the stock breaks out with massive volume.
This is not retail noise. This is big money entering the game.
But the real magic?
It doesn’t fall back. It holds the breakout zone, consolidates for a while—and then rockets upward.
This is the long range breakout setup.
When a stock breaks out of a multi-year range with strong volume and holds that level, you’ve found a potential big winner.
5.1 Psychology Behind Long Range Breakout Setup
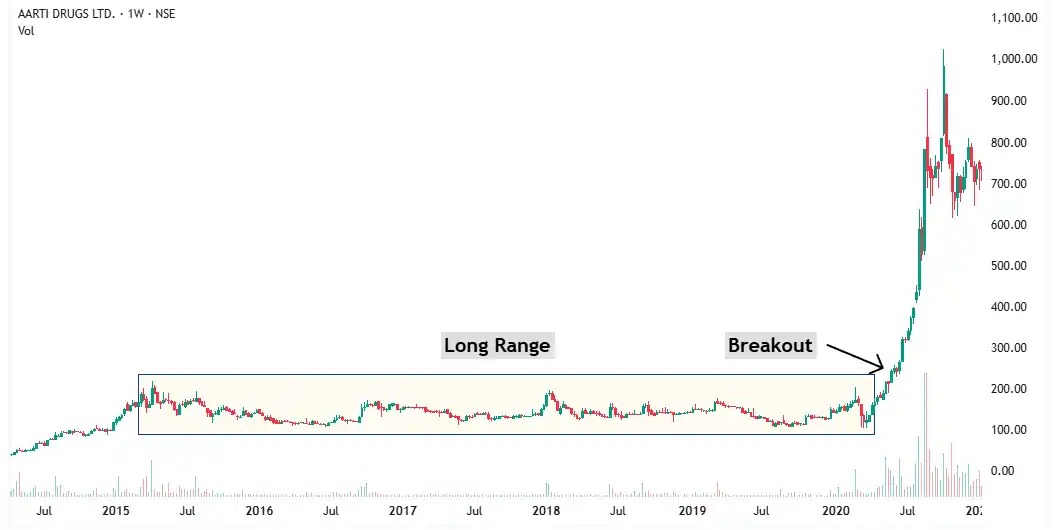
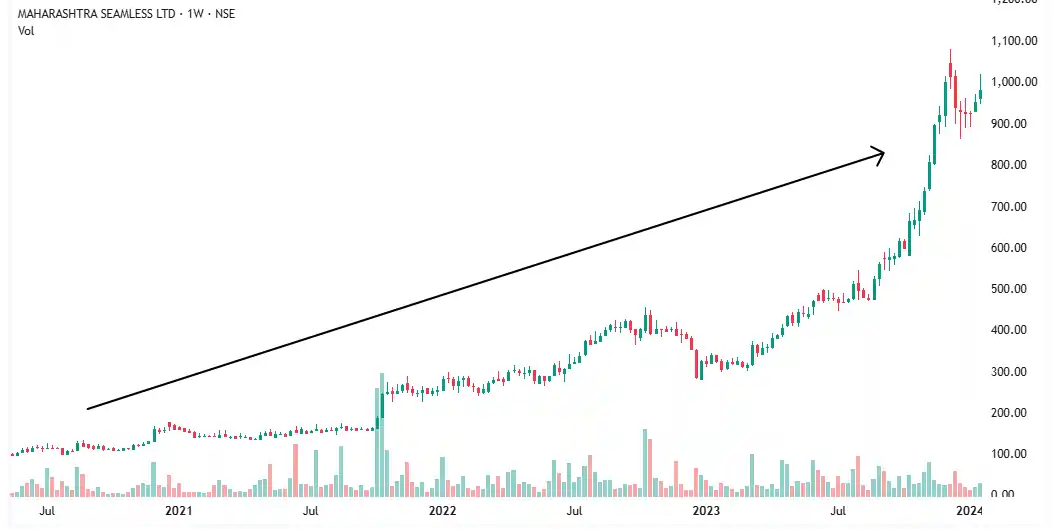
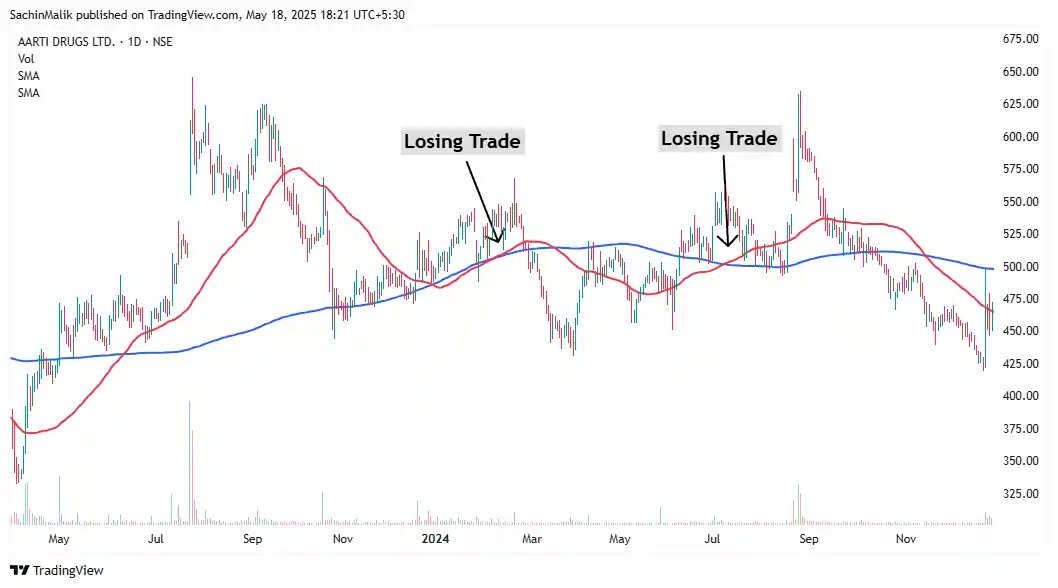
Look at Aarti Drugs.
The stock was going nowhere from 2015 to 2020. Just sleeping.
Why?
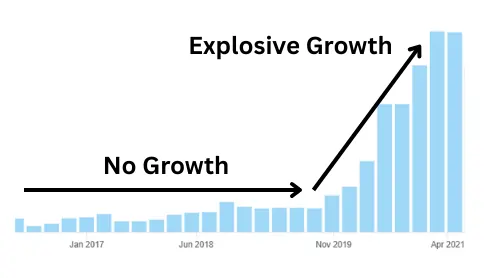
Because the company wasn’t growing.
No earnings growth = no stock price growth.
But then things changed.
The company started launching new products and expanding. Earnings took off—and so did the stock.
The breakout came on huge volume, a clear sign that institutional investors were buying in.
They had already done their homework. They knew the company’s future looked bright—so they entered early.
And their buying pressure pushed the stock higher.
As the company performed better, more big players joined in, and the rally accelerated.
Exactly this played out in Aarti Drugs.
When earnings were flat, the stock went sideways.
Once earnings began to rise, institutions stepped in—and the price exploded.
In the upcoming sections, I’ll show you how to read earnings patterns and spot high-probability swing trading opportunities before the big move starts.
5.2 How to Identify a Long Range Breakout Setup
To spot a long range breakout, you only need two things:
- Sideways price action for a long time — at least 12 months. The longer, the better.
- A breakout with massive volume. Volume is non-negotiable.
When both conditions are present, you’ve found a long range breakout.
Keep two principles in mind:
1. Bigger the base, stronger the case. The longer the base, the stronger the breakout tends to be.
2. No volume, no breakout. You need strong volume to lift the stock out of its sleeping range and push it higher.
Think of the long base as the foundation of a tall building. A solid foundation supports a massive structure.
And volume is the thrust that powers the move—just as a rocket needs massive force to lift off.
In short: look for a long base and a high-volume breakout. That’s your signal to act.
• Bigger the base, stronger the case — but only if volume backs it up.
5.3 Your Entry and Exit Point
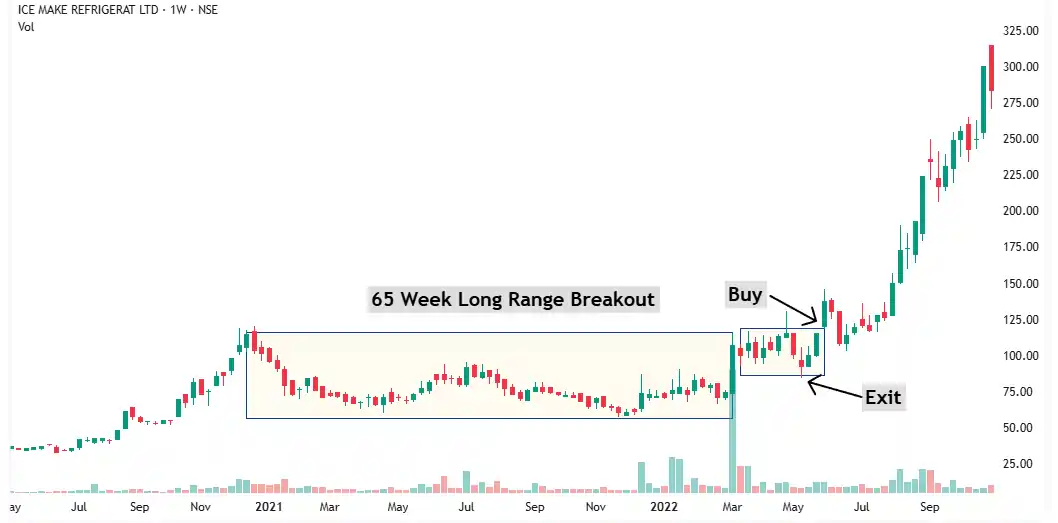
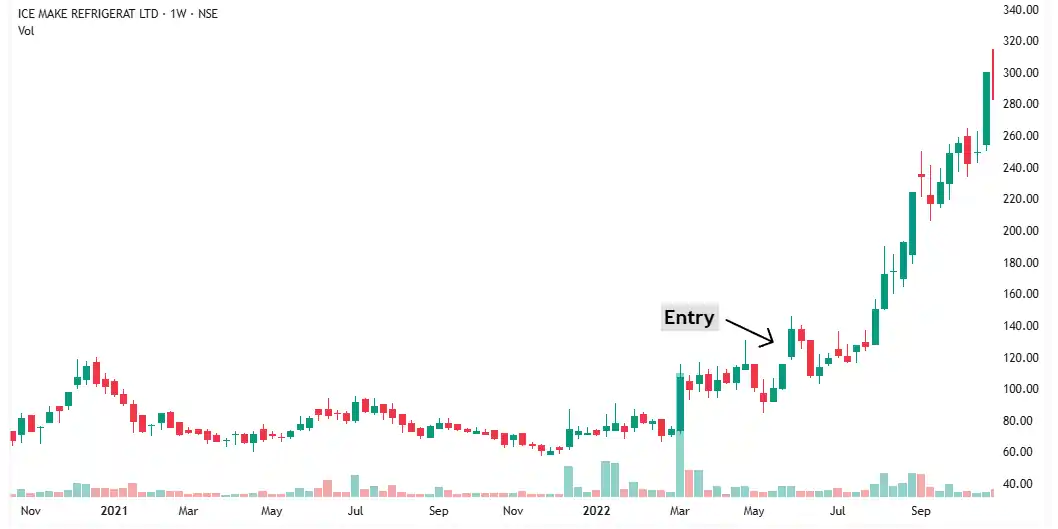
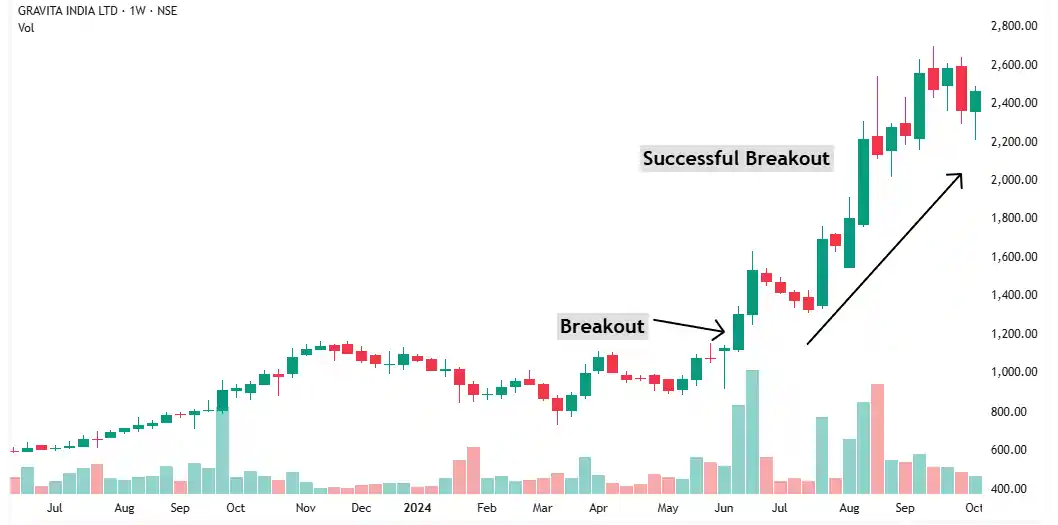
Icemake was in a sideways range for more than 65 weeks. Then suddenly, it woke up—breaking out with huge volume.
That volume is your first clue. It tells you something big is happening—institutions are entering, and the stock is getting ready to move.
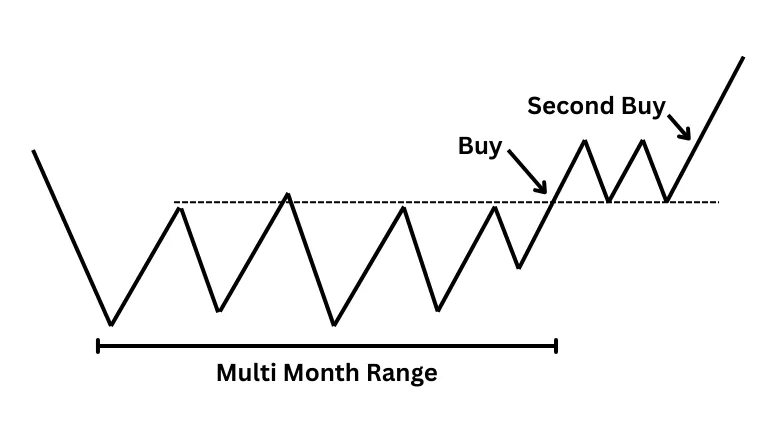
But don’t rush in just yet. This is not your entry point.
In a long range breakout setup, the stock often forms a smaller range near the upper edge of the larger base.
This is the setup within the setup.
Your entry signal comes when the stock breaks out of this smaller range on renewed volume.
Why this works:
When a stock breaks out with strong volume, it usually means institutional accumulation has started. But that accumulation doesn’t finish in one day.
Here’s what happens: Old investors—who held the stock for years with no returns—start selling into the breakout.
At the same time, new buyers are trying to enter. This creates a short-term tug of war.
The stock moves in a tight range as supply gets absorbed.
Once the sellers are done, the stock breaks out of this smaller range. That’s your moment to act.
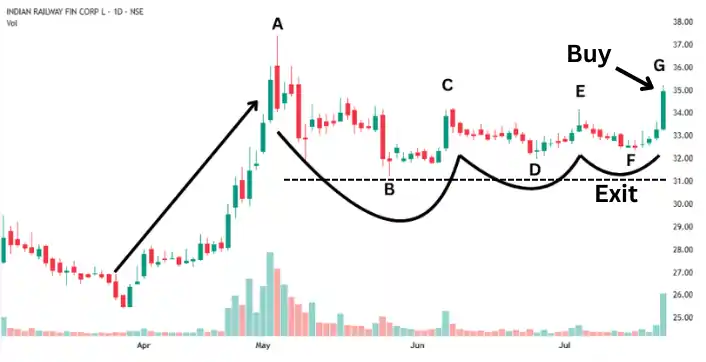
Exit point if you’re wrong:
Your exit point is simple—below the low of the smaller range.
If the breakout fails and the price slips below that zone, cut the trade.
That’s how you time your entry and manage your risk with clarity.
In all the previous strategies, I haven’t shared when to sell and book profits—because this topic deserves a dedicated deep dive.
I’ve covered the art of selling in a separate article. Reading it is crucial if you want to master not just entries, but exits too.
6. Best Swing Trading Strategy for Beginners
If you’re new to swing trading and unsure where to start, here’s my clear recommendation:
Start with the Power Play Setup.
Power play setup is the best swing trading strategy for beginners.
6.1 Why Power Play Setup is Ideal for Beginners
Because it’s simple to spot, simple to execute, and highly reliable for beginners.
Just look for a stock that has gone up over 100 percent in a straight line.
Wait for a tight consolidation.
Once it breaks out, you buy.
That’s it.
No fancy indicators. No complex rules.
It’s one of the most beginner-friendly strategies — yet powerful enough for seasoned traders.
6.2 My Tip for Beginners: Use Weekly Time Frame
Use the weekly time frame for both entry and exit.
Why?
Because signals on higher time frames are more reliable.
Shorter time frames often give false signals and force you into stressful decisions.
The weekly chart gives you clarity, confidence, and enough time to plan — even if you’re trading part-time with a job or business.
Power Play Setup plus Weekly Time Frame is the perfect combo for beginners.
Once you’ve mastered this setup, there are ways to take your swing trading to the next level.
In the upcoming section, I’ll walk you through how to boost your success rate even more.
• One simple strategy. A weekly chart. That’s all you need to start.
7. Why Most Traders Lose Money in Swing Trading?
It’s not because they lack discipline — it’s because they’re playing the wrong game.
7.1. They Don’t Understand The Truth.
Most swing traders wrongly believe that stock prices go up because of chart patterns.
They think spotting a bullish pattern means the stock will rise.
But here’s the ugly truth: chart patterns don’t cause price moves — they are the effect.
Stock prices go up when the company grows its earnings.
If a company performs well and increases profits, the stock price eventually reflects that.
Here’s how it actually works: First, large institutional investors do deep fundamental research.
They anticipate that the company’s earnings will rise in the future.
So they start buying the stock early — before the growth shows up.
That buying activity creates the chart patterns traders see.
Later, when the company’s earnings actually improve, even more institutions join in, pushing the price higher.
Price moves happen because informed investors are accumulating shares in anticipation of future growth — not because of the pattern itself.
When you buy a bullish chart pattern, you’re simply trying to catch the wave that institutional buying has already started.
The chart didn’t create the move.
It only reflected what was already happening behind the scenes.
There is a way to spot future earnings growth before it happens — and it’s even possible to anticipate what big money might do next, before they actually do it.
I’ve revealed it all in the HERO strategy.
• Chart patterns don’t move prices — earnings do.
7.2 They Don’t Understand The Random Nature Of The Market.
Most swing traders expect quick, consistent results.
They believe if a setup has an edge, it should work almost every time.
But swing trading doesn’t work like that.
The market is random in the short term — even with the best strategies.
You can have a setup with a 50% win rate and a 2:1 reward-to-risk ratio.
It’s a profitable system over 50 or 100 trades.
But in the short run, it might give you five losses in a row.
And that’s when most traders give up. Not because the strategy is bad — but because they couldn’t handle the randomness.
They expect clean results.
But swing trading is messy.
The wins and losses don’t come in order.
Losses cluster. Doubt creeps in. Confidence collapses.
They abandon a good system right before the winners show up.
This is how the stock market fools you.
• A good system still gives losing streaks — don’t quit before the winners show up.
7.3 They Ignore Mental Analysis.
Most swing traders begin with technical analysis.
Then, over time, they realize that adding fundamental analysis improves their results — so they start using that too.
But there’s one critical piece they still miss: mental analysis.
They don’t understand themselves.
They don’t see how their own emotions are sabotaging their trades.
Understanding your emotional problems is just as important as understanding chart patterns or company fundamentals — maybe even more.
Swing trading isn’t just about charts and earnings — it’s also a psychological game.
If your emotions aren’t under control, every market swing will feel like a roller coaster.
You’ll overreact, exit too soon, or abandon a great setup at the worst possible time.
In upcoming sections, I’ll show you how to control your emotions in swing trading — because if you don’t, they’ll destroy your strategy, your confidence, and your capital.
8. Quick Tips To Make Your Swing Trading More Powerful
It doesn’t matter which strategy you use — these quick tips will instantly improve your results.
They’re simple, easy to apply, and designed to boost your win rate.
Let’s start.
8.1 Tip #1: Use Relative Strength
Relative strength is one of the most powerful tools in technical analysis.
Add it to your process and you’ll see better results right away.
What is it?
You compare a stock with another stock or with the market. The one holding up better is stronger.
Avoid weak stocks. Focus on strong ones.
Weak stocks often give false breakouts. Just using this one filter helps you skip most of them.
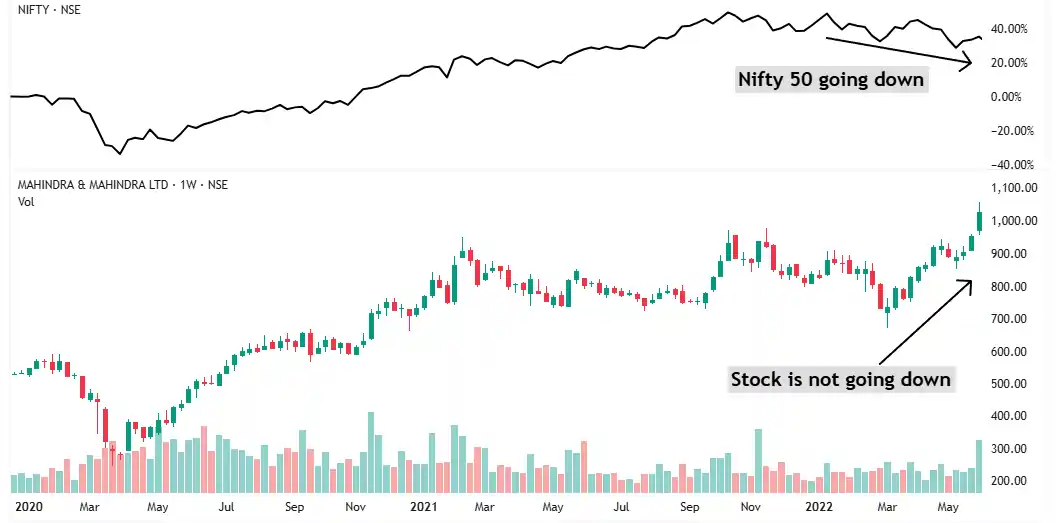
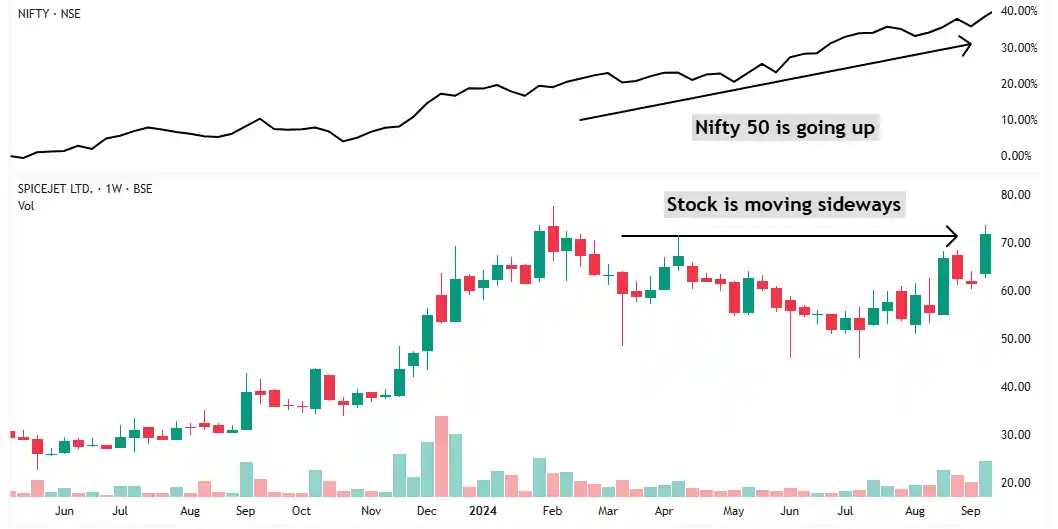
The black line shows Nifty 50.
While the market was falling, this stock stayed flat — that’s high relative strength.
Sellers couldn’t push it down even in a weak market. This shows strong demand.
When such stocks break out, they often lead the next rally.

Relative strength helps you catch real breakouts — and avoid traps.
Now look at this.
Would you buy this breakout?
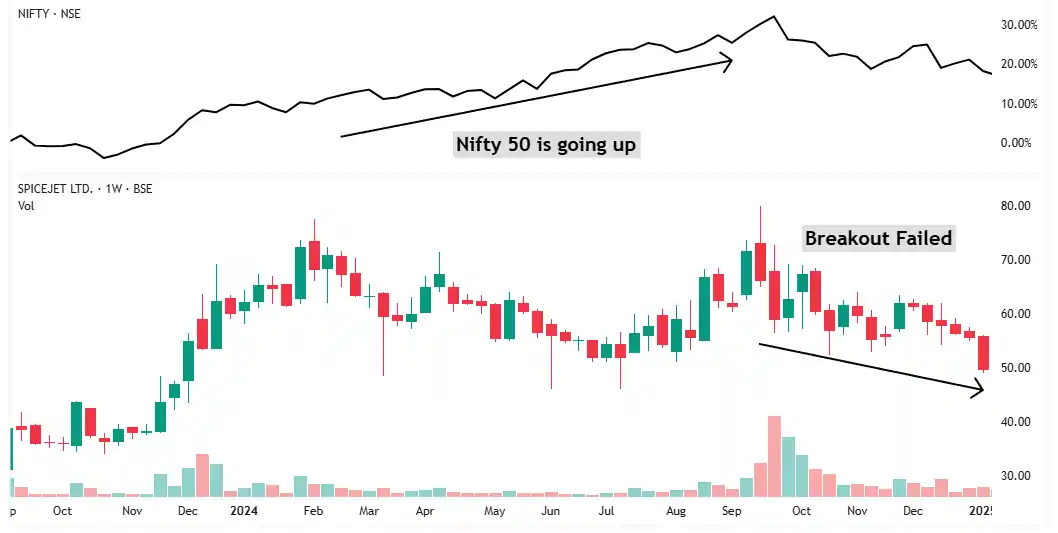
While Nifty was going up, this stock went sideways. That’s weakness.
Breakouts in weak stocks usually fail — and this one did.
Using relative strength helps you avoid trades like this — and focus on the winners.
8.2 Tip #2: Trade in a Strong Sector
Stocks don’t move in isolation — they move in groups.
If you trade a stock from a strong sector, your chances of a successful move go up significantly.
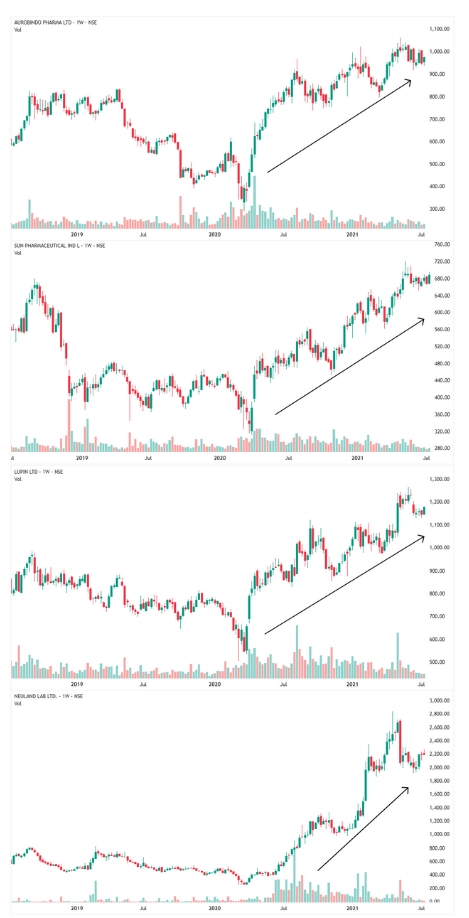
In 2020, when COVID hit, pharma stocks took off.
Almost every company in the sector was doing well, and their charts reflected that.
If you traded chart patterns in this sector, you likely made money.
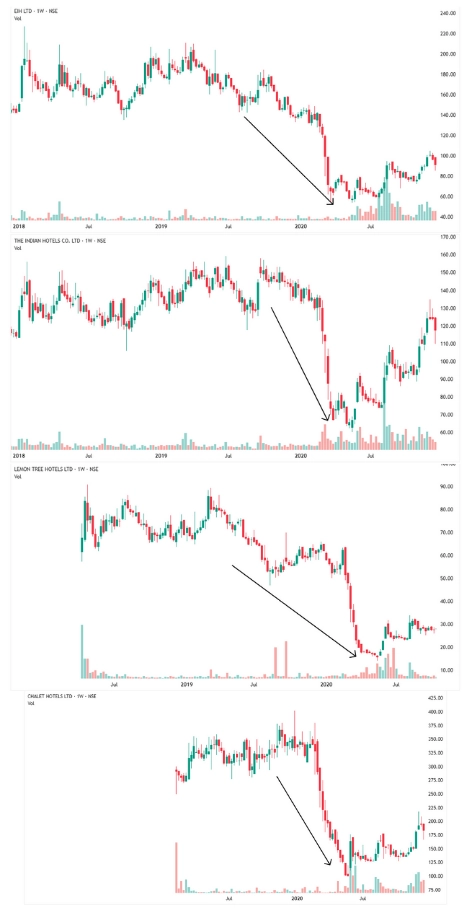
Now look at the hotel sector in the same year.
Tourism stopped, and every hotel stock struggled.
No matter how good the chart looked, trades in this sector mostly failed.
That’s the power of sector selection.
Just by picking a stock from a strong sector, you stack the odds in your favour.
So how do you find a strong sector?
Simple — use relative strength.
Compare the sector index chart with the market index.
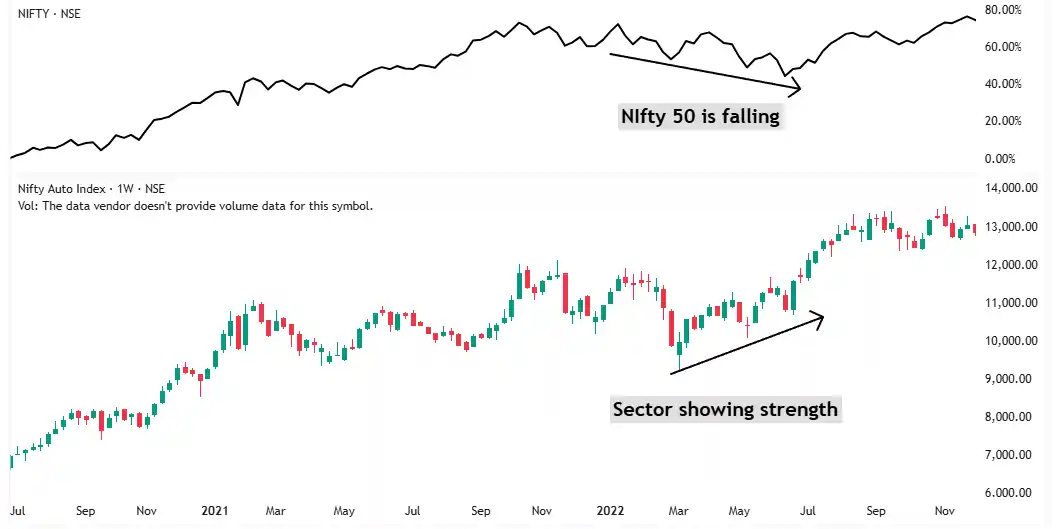
If the sector is going up while the market is falling, it’s showing strength.
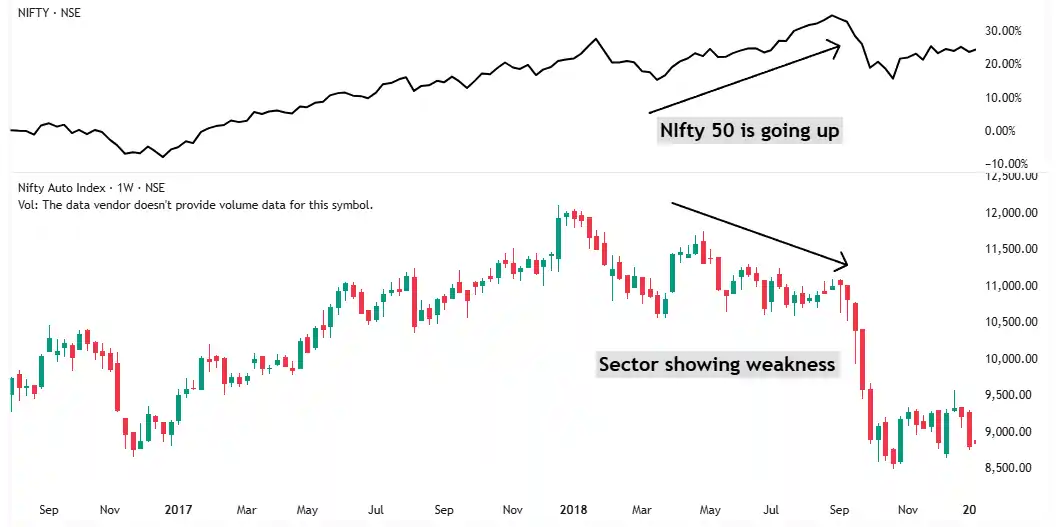
If the sector is falling even when the market is rising, that’s weakness.
Trade stocks from strong sectors. Avoid the weak ones. Watch your win rate improve.
It’s simple. It’s powerful. It works.
• Stocks move together — go with the strongest group.
8.3 Tip #3: Use Earning Patterns
Just like chart patterns help you spot breakouts, earning patterns help you filter the good ones from the bad.
What’s an earning pattern?
It’s the trend in a company’s quarterly profits.
If the earnings are consistently going up, the company is doing something right — and that trend is likely to continue.
When you buy a breakout in such a stock, your odds of success go up.
Why?
Because stock prices depend on earnings.
If earnings go up, price will go up. It’s that simple.
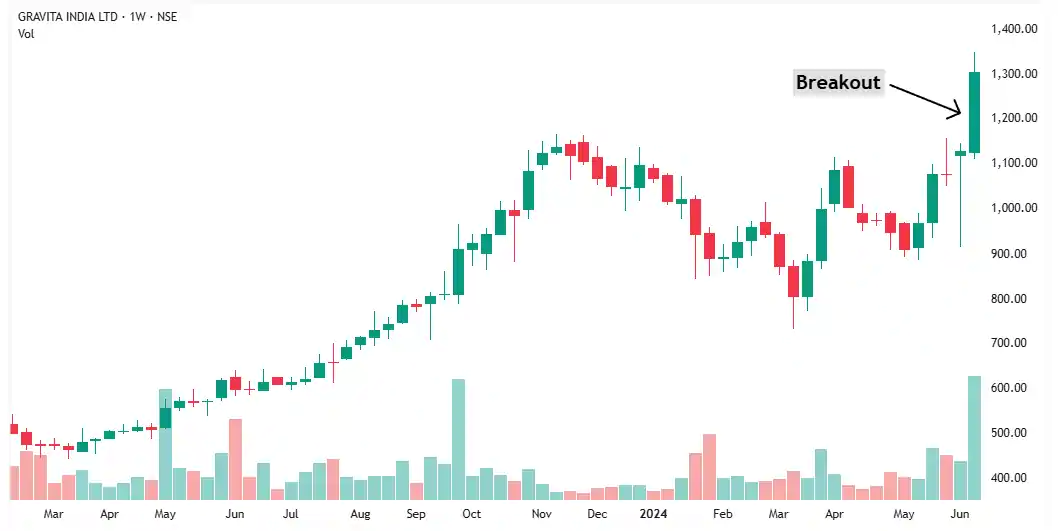
Will you buy this breakout?
Well, check the earning pattern also.
Earnings are going up, so the chances of this breakout working are high.
By buying a stock where the earnings are expected to go up, you increase your chances of a successful breakout.
If the earning chart pattern of a company is in an uptrend, then most likely this trend will continue.
There is a way to predict the future earnings growth of the company.
There is a way to estimate the future price of any stock.
I have explained everything in detail in my HERO strategy.
• When earnings rise quarter after quarter — price has no choice but to follow.
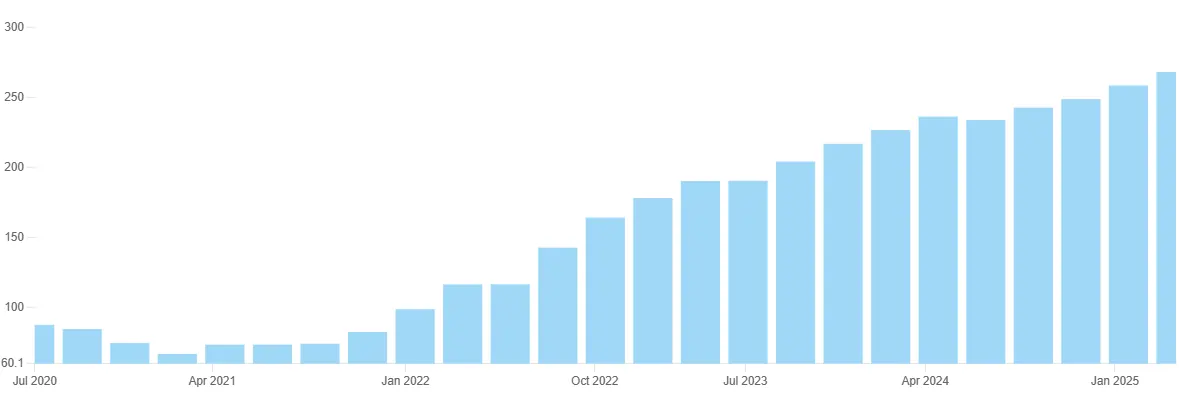
8.4 Tip #4: Use Shareholding Pattern
Just like you use earnings growth to improve your success rate, you can also use shareholding pattern.
What is shareholding pattern?
It shows who owns how much of the company — promoters, FIIs, DIIs, and retail investors. But here’s the key: Focus on what the management is doing.
The management knows their business better than anyone.
They understand the company, the product, the competition, and the future outlook.
So, if they are increasing their stake, it usually means one thing: They expect the company to do well.
On the other hand, if they are selling, it could be for many reasons — personal needs, diversification, etc. But when they are buying, it’s almost always a strong sign of confidence.

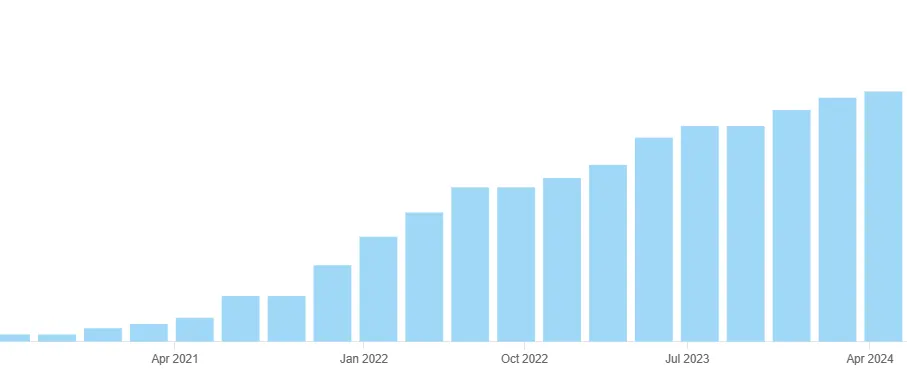
Here’s the shareholding pattern of MahSeamless. As you can see, the management kept increasing their stake over time.
Stock price consistently did well.
That’s the power of tracking insider behaviour.
I personally use Screener.in to check the shareholding pattern of any stock.
It takes just one minute — but can dramatically improve your stock selection.
8.5 Tip #5: Avoid Companies With Excessive Debt
Debt is a double-edged sword. It can multiply returns when used wisely — or destroy companies when misused.
If you study failed businesses, the reason most of them collapse isn’t a bad team or lack of market opportunity.
It’s too much debt.
There’s a simple ratio that tells you this: debt-to-equity ratio. It shows how much debt a company has compared to its equity.
If a company’s debt-to-equity ratio is more than 3, that’s a red flag.
Such companies are risky and should be avoided in swing trading.
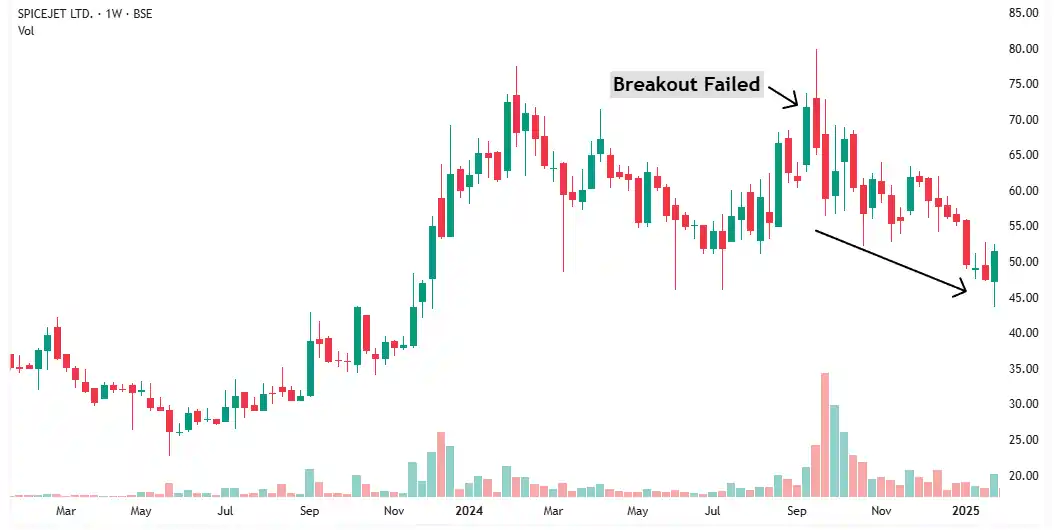
Take SpiceJet for example.
This breakout looked strong — big volume, clean breakout. Most traders would’ve bought.
But its debt-to-equity ratio at that time?
119.
I told you to avoid anything above 3. This one had 119 — and the stock crashed soon after.
Just by checking this one number, you can avoid most fake breakouts and protect your capital.
These 5 simple tips can dramatically improve your swing trading success rate.
But to win consistently, you must also avoid the traps. Let’s look at popular swing trading strategies you must avoid.
• If debt to equity ratio is above 3, walk away — no matter how good the chart looks.
9. Popular Swing Trading Strategies You Must Avoid
The market punishes good people with bad swing trading strategies.
These flashy setups look great in courses and social media reels—but they quietly drain your capital, one trade at a time.
Let’s break down the popular swing trading strategies you must avoid if you want to survive in this game.
9.1 Avoid Indicator-Based Strategies
When a new trader enters the market, the first thing he discovers is technical indicators.
They look magical. Promising. Scientific.
He believes there must be a secret indicator that all successful traders use.
So he starts experimenting.
Most people begin with moving averages.
They learn fancy terms like the golden crossover — Buy when the 50-day moving average crosses above the 200-day moving average.
It’s simple. It’s clean. It looks powerful in books and YouTube tutorials.
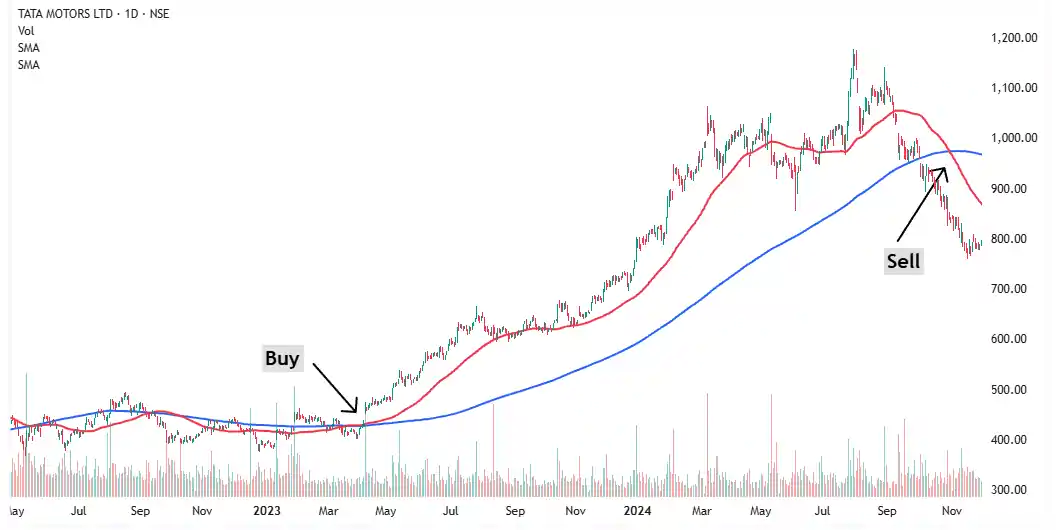
So you try it. You expect to catch a strong trend and ride it.
But in real trading?
You lose money.
Not once. Not twice. Again and again.
Then comes the frustration: “I’m following the textbook. I’m doing everything right. Why am I still losing money?”
Because these strategies are outdated.
They might have worked in the 1980s. But this is the 2020s — a world ruled by high-frequency algorithms and institutional dominance.
These algorithms have killed the edge of traditional indicator-based swing trading strategies.
Yet beginners keep falling for them.
Why?
Because that’s what all trading books and YouTube gurus keep promoting.
When one indicator fails, the trader jumps to another:
RSI → MACD → Bollinger Bands → ADX → Ichimoku…
And the result?
Same story.
Losses. Confusion. Hopelessness.
I know this because I’ve lived it.
I’ve tested every major indicator. Read every book. Tried every formula.
Here’s the ugly truth: All indicators are lagging. All indicators are useless.
They take past price data, apply a formula, and draw smooth lines on your chart.
They don’t predict anything. They only react to what’s already happened.
So by the time an indicator gives you a buy signal, the smart money has already moved.
If you’re still relying on indicators, brace yourself for a long, painful, and expensive journey.
Take it from someone who’s been there — If you truly want to make money from swing trading, stay away from indicator-based strategies.
They don’t give you an edge. They only waste your time, money, and hope.
• By the time indicators flash buy, smart money is already in.
9.2 Avoid Trendline-Based Strategies
Another popular — and losing — method is the trendline strategy.
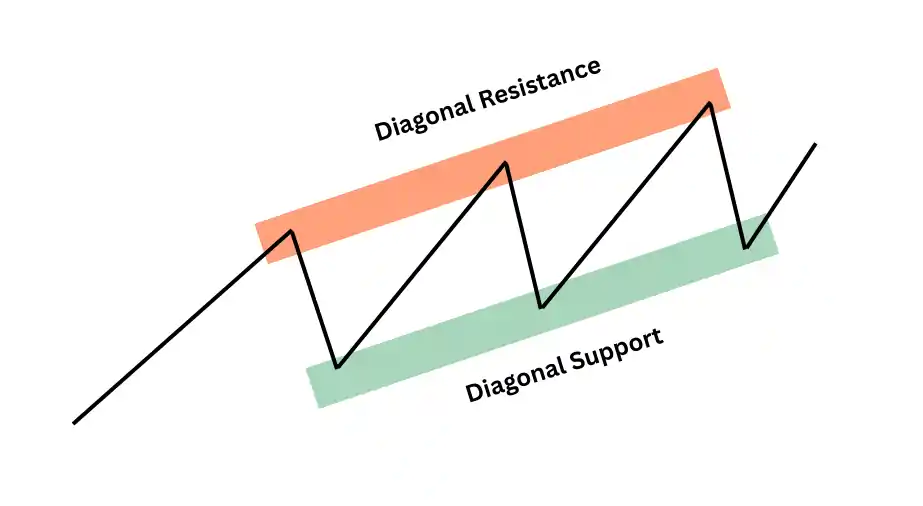
You’ve seen it. Diagonal lines connecting highs and lows.
People draw them to predict future moves.
But here’s the truth: Trendlines don’t work.
They look clean in hindsight.
But in real-time? They’re useless.
I’ve spent hours trying to make them work.
Backtested them. Traded them. Failed with them.
They’re a trap.
Here’s why:
- Everyone draws them differently. It’s not analysis — it’s guesswork.
- They break all the time. Price doesn’t care.
- Institutions ignore them. They act on horizontal levels, not slanted lines.
Trendlines are in every technical book.
And that’s the problem.
Most traders lose because they follow what’s popular — not what works.
The market respects horizontal support and resistance. That’s where demand and supply actually sit.
If you want to stop bleeding money, stop using trendlines. Use what the market respects. Not what books say.
• Markets respect horizontal levels — not your diagonal imagination.
9.3 Avoid Pure Price Action Strategies
Wait — first I told you to ignore indicators.
Now I’m saying don’t rely on pure price action either?
So what’s left?
Let me be clear: I’m not saying price action doesn’t work.
In fact, all 3 swing trading strategies I shared in this article are based on price action.
But here’s the catch: Price action alone is not enough.
Most traders just look at a chart and start buying or selling.
No context. No deeper analysis. That’s where they go wrong.
To win, you need to combine price action with what I call smart filters — relative strength, sector strength, earnings pattern, shareholding pattern, and debt-to-equity ratio.
These are the five swing trading filters I’ve shared in this article. Use them.
When you combine price action with fundamentals and context, that’s when the magic happens.
That’s when patterns actually make sense.
That’s when your conviction goes up — and your mistakes go down.
Don’t trade blind. Zoom out. See the bigger picture.
That’s how you win.
Most traders never reach this level of clarity. They keep using half-baked setups without these filters — and then wonder why nothing works.
But it’s not just about strategy. Even with the right tools, one mistake can ruin everything.
So before we wrap up, let’s look at the common mistakes swing traders make — and how to avoid them.
• Price action without filters isn’t strategy — it’s just hope in disguise.
10. Common Mistakes To Avoid In Swing Trading
Most swing traders lose money not due to lack of effort, but because they keep repeating the same avoidable mistakes.
They jump into trades with high hopes, but without the right process — and end up frustrated when nothing works.
If you want consistent results, you must avoid the common traps that silently kill your progress.
Let’s look at the top three mistakes most swing traders make — and how to avoid them.
10.1 Constantly Switching Strategies
This is the biggest mistake of all.
New traders keep jumping from one strategy to the next.
They try a breakout strategy for a week. It doesn’t work. Then they switch to reversal setups. That doesn’t work either. So they move to indicators. Again, no success.
They’re always in search of the “perfect” system — but never stick with anything long enough to master it.
The truth is, you don’t need ten different strategies. You just need one that works — and you need to know it inside out.
Like Bruce Lee said, “I fear not the man who has practiced 10,000 kicks once, but the man who has practiced one kick 10,000 times.”
Trading is no different.
It’s not about how many strategies you know. It’s about how well you know one.
Pick one swing trading strategy — whether it’s VCC, Power Play, or Long Range Breakout — and go deep.
Understand it. Trade it. Refine it.
Mastery beats variety.
• Stop hunting for magic. Start mastering one setup deeply.
10.2 Ignoring the Bigger Picture
Most traders only look at the stock they’re trading.
They forget to check the broader market.
Is the Nifty trending up or down? Is the sector showing strength or weakness?
Without macro context, your decisions become random.
Imagine buying a stock during a market correction — just because it gave a breakout.
Chances are, that trade will fail.
Why?
Because the market tide pulls everything down with it.
Macro analysis helps you adjust your risk.
When the market is strong, you go aggressive. When the market is weak, you stay cautious.
Skipping this step leads to poor entries and unnecessary losses.
Before buying any stock, always ask: What is the market telling me right now?
10.3 Not Backtesting Their Strategy
Another mistake traders make is diving in without testing.
They learn a new strategy and immediately start buying and selling with real money.
Then they lose — and blame the strategy.
But in most cases, the problem isn’t the strategy. The problem is lack of preparation.
Success in swing trading doesn’t come from knowing more. It comes from going deeper.
You wouldn’t fly a plane without training. Why trade without backtesting?
Before you risk your capital, test the setup. Look at historical charts.
See how it behaved in different markets. Note what worked, what failed, and why.
Backtesting builds confidence. It tells you what to expect. And most importantly — it prepares you for real trading.
Key Takeaway
Don’t try to master everything at once.
Choose one of the three swing trading strategies I’ve shared in this article.
Stick with it.
Backtest it.
Build real experience through it.
• If you haven’t backtested it, you have no right to trade it.
11. Swing Trading vs Day Trading vs Positional Trading – Which Style Is Right for You?
Many traders jump into the market without knowing which trading style suits them best.
In this quick guide, I’ll help you choose the right one — based on real-world insights, not hype.
11.1 Swing Trading vs Day Trading
Day trading sounds exciting — buy in the morning, exit by afternoon, and repeat daily.
But here’s the hard truth: day trading today is dominated by high-frequency algorithms.
You’re not competing with other retail traders — you’re competing with bots running thousands of trades per second.
If you try to play that game, you’ll lose.
That’s why day trading is a terrible choice for most people.
Swing trading, on the other hand, gives you time. You ride bigger moves, hold for a few days or weeks, and make decisions with clarity.
If you’re trading part-time or want less stress, swing trading is the smarter path.
11.2 Swing Trading vs Positional Trading
Swing trading focuses on one swing at a time — you buy when a new move starts and exit when it’s over.
Positional trading is more relaxed — you hold for months and ride multiple swings in one trade.
Now here’s the key: The longer your time frame, the easier it becomes to make money.
So yes — positional trading works.
In fact, the 3 strategies I’ve shared in my main article (VCC, Power Play, Long Range Breakout) work beautifully for both swing and positional styles.
The only difference is in your holding period and trade management.
12. How to Identify the Best Stocks for Swing Trading
You don’t need to track 5,000 companies to succeed in swing trading.
In fact, the narrower your focus, the better your results.
Here’s a simple 3-step filter to help you find best stocks for swing trading
12.1 Define Your Trading Universe
Don’t try to track every stock on the market — it’s overwhelming and unnecessary.
Limit your universe to a focused list of quality stocks.
Recommendation: Stick to the Nifty 500 stocks.
It gives you a wide enough range — across large, mid, and small caps — without flooding your watchlist.
12.2 Choose Liquid Stocks
Swing trading requires clean entries and exits.
If a stock has low volume, you’ll get stuck — especially when you need to exit fast.
Avoid illiquid stocks.
Always check average daily traded value. If it’s too low, skip it.
All Nifty 500 companies are liquid enough — that’s why they’re ideal for swing traders.
12.3 Prefer Volatile Stocks
If a stock doesn’t move, you won’t make money. Swing trading relies on price swings — and that means volatility.
Look for stocks that:
- Break out of ranges
- Show strong up moves
- Have clean momentum patterns
Flat, slow stocks = wasted time and capital.
Only trade where there’s action.
• Don’t trade everything — trade what moves, what’s liquid, and what you understand.
13. How to Control Your Emotions in Swing Trading
Most swing traders fail for two reasons:
- They don’t have a solid strategy.
- They can’t control their emotions.
Even with a decent system, fear, doubt, and regret can destroy execution.
But it doesn’t have to be that way.
In this article, you’ll learn two techniques to end your emotional problems in swing trading—so you can trade with clarity, confidence, and control.
13.1 Think in Probabilities, Not Guarantees
No setup works every time.
The market doesn’t offer guarantees—only odds.
The best traders in the world accept this. They don’t say, “This trade will work.”
They say, “There’s a 70% chance it’ll work—and I’m fine with the 30% that it won’t.”
This mindset reduces pressure.
You stop tying your identity to each trade. You stop reacting emotionally when a setup fails. You simply move to the next one.
Once you stop expecting the market to follow your script, your stress fades—and your execution improves.
• A 70% win rate means 3 out of 10 trades will hurt — accept it.
13.2 Use A Strategy You Trust
If your trading is based on tips, news, or gut feeling—emotions will always win.
You’ll hesitate. Overthink. Exit too early. Chase after losses.
But with a clear, rule-based strategy, you take the guesswork out of trading.
You know when to enter, when to exit, and how much to risk—no matter what the market is doing.
That clarity gives you control. It silences the noise.
A good system doesn’t eliminate losses—but it eliminates emotional decision-making.
You don’t panic. You execute. Consistently.
• When you trust your system, you stop reacting — and start executing.
14. Best Books On Swing Trading Strategies
If you want to become a consistently profitable swing trader, you must learn from those who’ve mastered the game.
Here are three swing trading books I highly recommend. Each one has directly influenced the strategies I use—and teach.
14.1 How to Make Money in Stocks by William O’Neil
This book teaches one of the most powerful methods ever created for making money in the stock market. O’Neil’s CANSLIM approach has stood the test of time.
I personally use a refined version of this system in my own trading—and it works.
14.2 Think and Trade Like a Champion by Mark Minervini
Minervini’s style of trading is aggressive, precise, and rooted in momentum.
My VCC and Power Play setups are directly inspired by the techniques explained in this book.
14.3 Trading in the Zone by Mark Douglas
No swing trader can win consistently without mastering their emotions.
This book is the gold standard in trading psychology. If you struggle with fear, hesitation, or overtrading—this book will open your eyes.
The last chapter alone can permanently shift how you think about losses, risk, and discipline.
These swing trading books are not optional—they’re essential.
Study them. Internalize them. Apply them.
They’ll sharpen your edge, strengthen your mindset, and take your trading to the next level.
• You don’t need more signals — you need fewer emotions.
15. Your Roadmap To Becoming A Profitable Swing Trader
Profitable swing trading isn’t about luck, IQ, or chasing hot tips.
It’s about learning a proven process—and following it with discipline.
If you’re serious about making consistent money from the market, stop relying on random YouTube videos and start following a step-by-step roadmap built for results.
This is the path I wish I had when I started. It cuts through the noise, saves you years of trial and error, and shows you exactly what works—and what doesn’t.
Start here:
Step 1: Avoid These Costly Mistakes
Before you grow your capital, you need to protect it.
Most traders sabotage themselves without even realizing it.
Learn how to avoid the silent killers of your portfolio—so you can stop bleeding and start building.
Step 2: Master Mental Analysis
Technical skills mean nothing if your emotions take over.
This step shows you how to recognize emotional traps like FOMO, fear, and revenge trading—and how to overcome them with total control.
Step 3: Learn What Works in Technical Analysis
Most traders get lost in indicators that look smart but don’t work.
This step cuts through the noise and shows you what actually works—and more importantly, what doesn’t.
Step 4: Master Fundamental Analysis—Without the Jargon
You don’t need to be a CA or fund manager to analyze companies.
Learn how to quickly filter out weak stocks, identify fundamentally strong ones, and make smarter, conviction-based trades.
Step 5: Read the Market Like a Pro (Macro Analysis)
Most traders never look beyond individual stocks.
This step shows you how to read the broader market trends and understand what smart money is doing—so you’re always trading in the right direction.
Bonus Step: Join the Newsletter
Get my weekly stock ideas, lessons, and insights delivered straight to your inbox.
No noise. No fluff. Just practical insights you can use to trade smarter and grow faster.
16. Frequently Asked Questions
16.1 Is swing trading suitable for beginners?
Yes — swing trading is not just suitable, it’s highly recommended for beginners. Unlike intraday trading, which is dominated by high-frequency algorithms, swing trading gives you time to think, plan, and execute with discipline. With proper risk management and a proven strategy, beginners can succeed without being glued to the screen all day.
16.2 What are the best swing trading strategies for beginners?
The Power Play Setup is the best swing trading strategy for beginners. It’s simple, easy to identify, and doesn’t rely on complex indicators. But remember — no matter what strategy you choose, you must backtest it thoroughly and get comfortable with it before risking real money. Confidence comes from preparation.
16.3 Is swing trading profitable?
Yes, swing trading can be highly profitable — but only if you use the right approach. You need a well-tested strategy and strong emotional control. Most losses come not from bad setups but from emotional mistakes like exiting too early or abandoning the plan. Combine a solid process with discipline, and profits will follow.
16.4 How much capital do I need to start swing trading?
You can start swing trading with as little as ₹10,000. It’s better to begin with small capital while learning and backtesting. This way, your losses (if any) are limited. As your skills and confidence grow, you can gradually increase your capital and position size.
16.5 Can I do swing trading part-time with a job or business?
Absolutely. Swing trading is ideal for people with full-time jobs or businesses. You don’t need to watch the screen all day. With higher time frames like weekly charts, you can analyze and plan trades on weekends and simply monitor them during the week.
16.6 How much time is required for swing trading?
Once your strategy is ready, swing trading doesn’t take much time.
Initially, you’ll need to invest time in learning, building, and backtesting your system. But later, if you trade on weekly charts, a few hours on weekends is enough to analyze, plan, and manage your trades.
16.7 What is the best time frame for swing trading?
The best time frame for swing trading is the weekly chart — especially for beginners. Longer time frames offer more reliable signals and reduce the noise. You get cleaner setups, more time to react, and a higher probability of success compared to lower time frames like 5-minute or 1-hour charts.
16.8 What indicators are commonly used in swing trading?
Popular indicators include moving averages, RSI, MACD, and Supertrend. However, most of them are lagging and offer limited edge in today’s market. Instead, focus on price and volume. Use tools like relative strength, sector strength, earnings trends, and promoter shareholding — these give more reliable signals.
16.9 How to find the best stocks for swing trading?
Look for highly liquid and volatile stocks — especially from the Nifty 500 universe. Liquidity ensures you can enter and exit trades easily, while volatility allows you to capture meaningful price moves. Also, prefer stocks showing strong price action, sector leadership, and positive earnings momentum.
16.10 How do you handle emotions in swing trading?
Use a strategy that you’ve backtested thoroughly and trust completely.
Once you believe in your system, it’s easier to follow it without fear. Also, shift your mindset — think in probabilities, not guarantees. No setup works every time. Success comes from executing consistently over many trades.
17. Conclusion
Most traders lose because they follow the wrong strategies.
Now you know what actually works.
But knowing isn’t enough — execution is everything.
If you want to trade with confidence and stay ahead of the crowd…
Join the newsletter. Trade smarter. Win more. Miss less.