Beat Nifty 50 Using Nifty Meter
By Sachin Malik
Most investors lose money in the stock market — not because they pick bad stocks, but because they buy and sell at the wrong time.
They get excited when the market is booming and rush to buy — usually when the bull market is already near its peak.
Then, when the market crashes and fear is everywhere, they panic and sell — often near the bottom, just before the next rally begins.
In short, they buy high and sell low — the exact opposite of what it takes to make money.
And it gets worse.
By the time they realize they’ve made a mistake, it’s too late.
They miss the early stages of a new bull market — when the biggest gains are made — and end up chasing stocks after prices have already soared.
It becomes a never-ending cycle of frustration, regret, and missed opportunities.
But it doesn’t have to be this way.
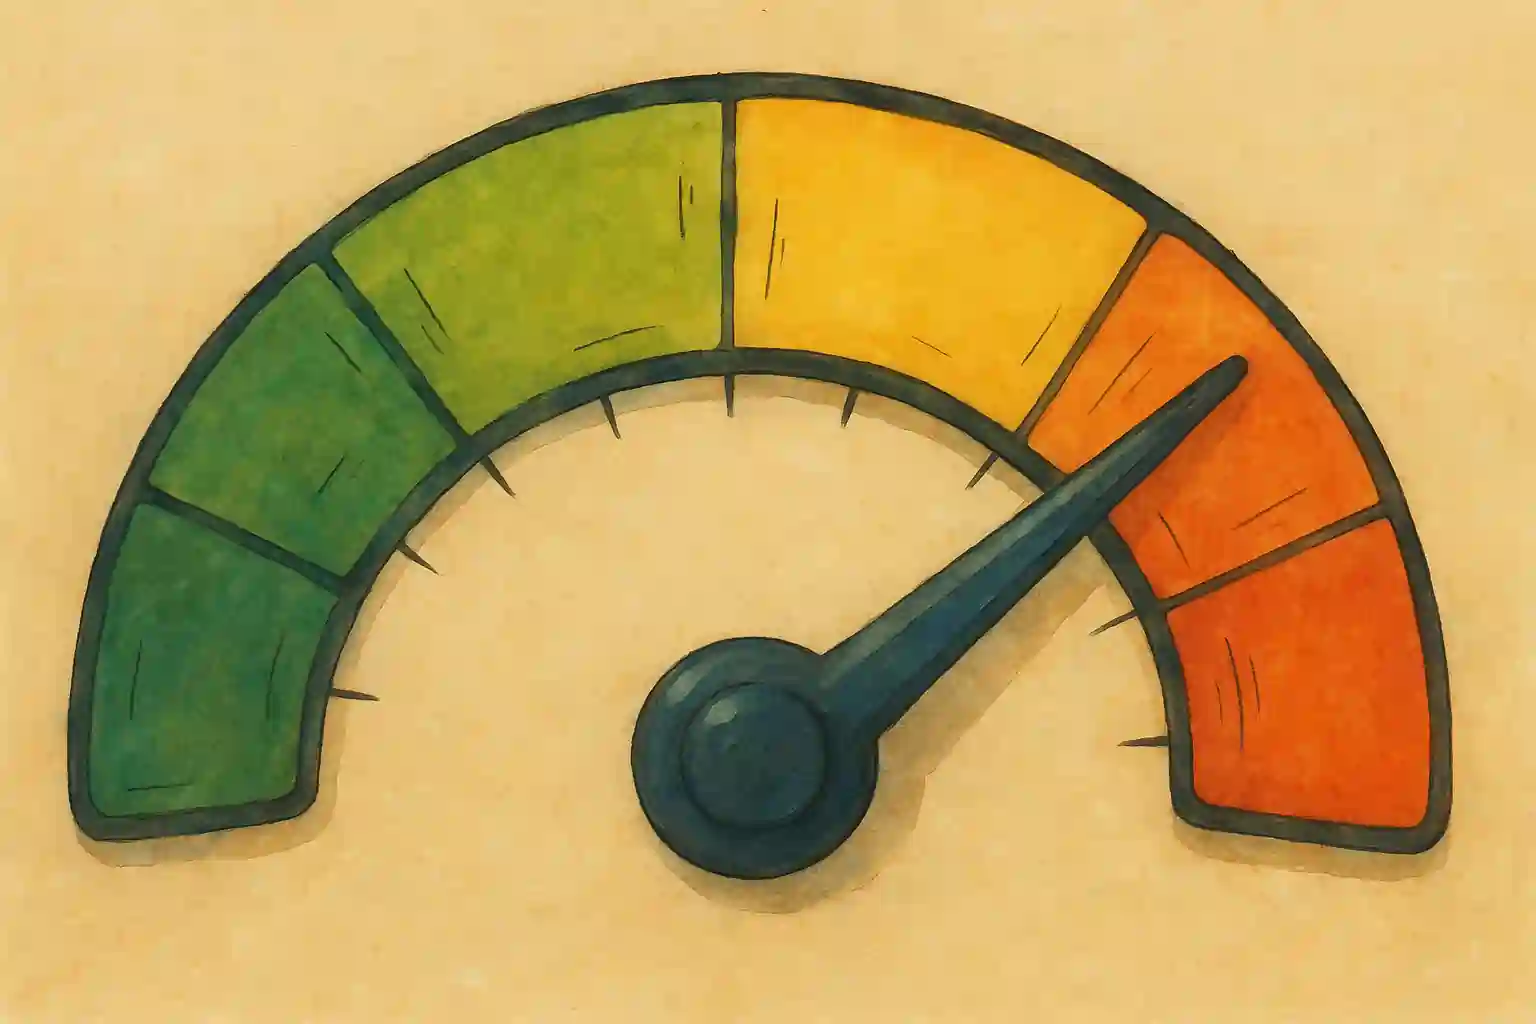
There is a simple and powerful tool that can help you break free from this cycle: the Nifty Meter.
The Nifty Meter gives you a clear, objective signal — helping you buy when the odds are truly in your favour, and sell when risks are high.
If you learn how to use it correctly, you can beat the Nifty 50 — not by picking better stocks, but by timing your moves better than the crowd.
Part 1. What Is the Nifty Meter?
The Nifty Meter is a simple valuation tool that helps you judge whether the overall market is cheap or expensive, based on the Price-to-Earnings (P/E) ratio of the Nifty 50 index.
By just glancing at the meter, you can instantly know whether it’s time to be aggressive or cautious.
1.1 Understanding Nifty Valuations
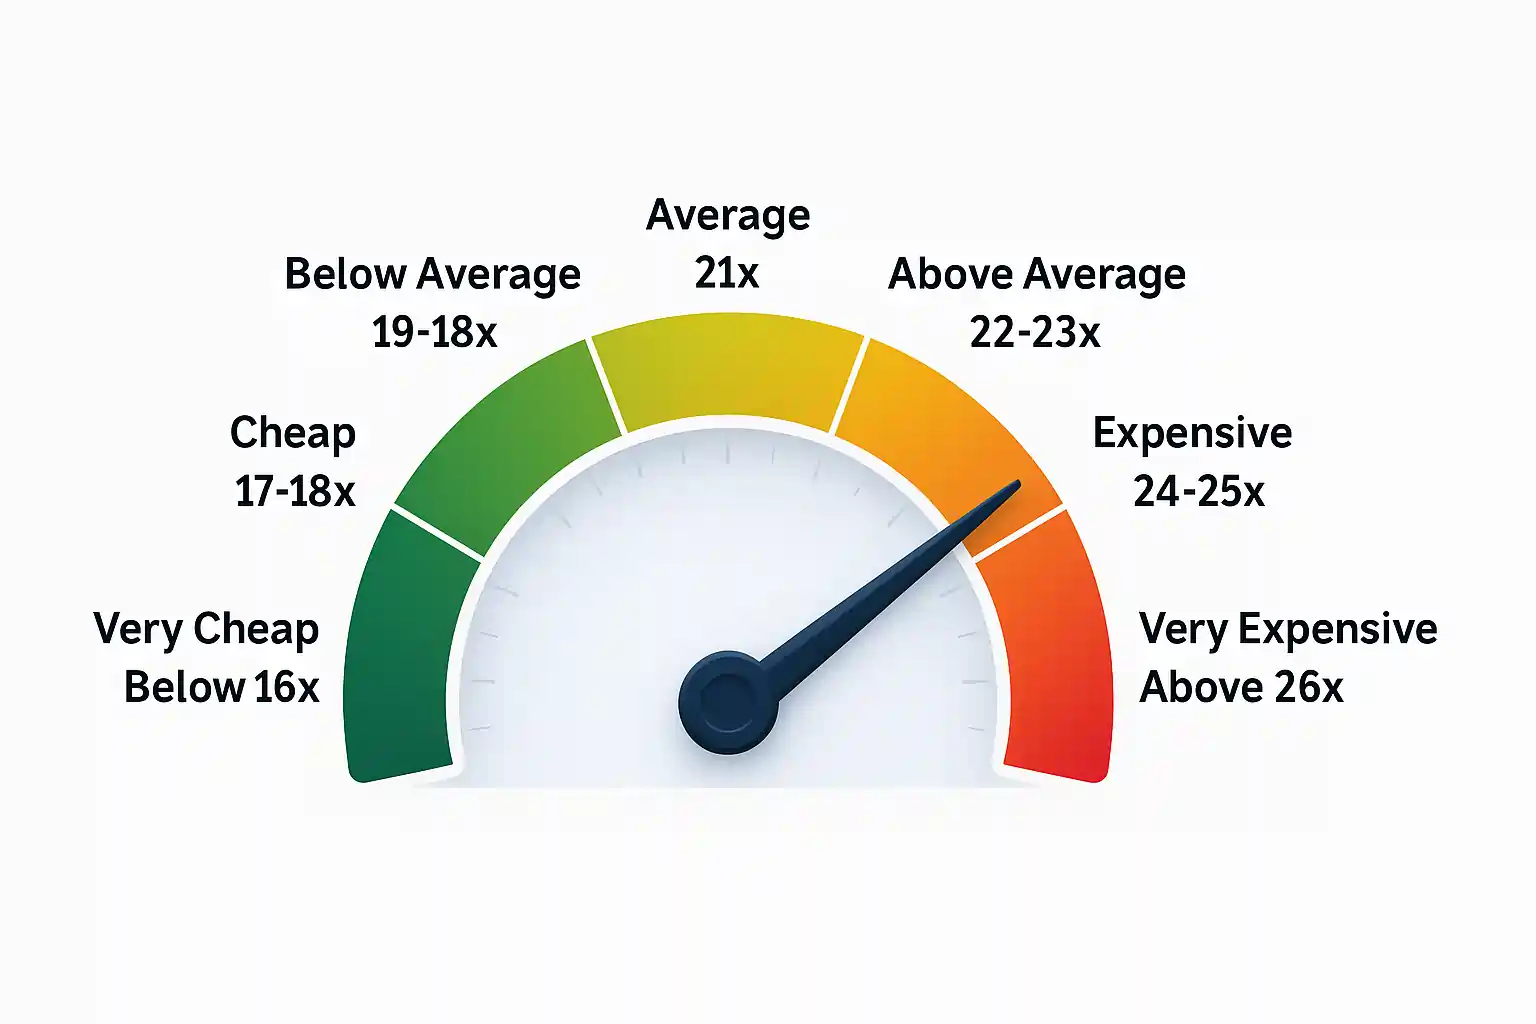
Based on historical data, the average P/E ratio of Nifty 50 lies between 20x and 22x. For simplicity, we take 21x as the fair value.
This is the neutral zone, where the market is fairly priced — neither cheap nor expensive.
Here’s how to interpret the Nifty Meter:
P/E Ratio | Valuation Level | Action |
≤ 16x | Very Cheap | Go aggressively |
17x – 18x | Cheap | Begin accumulating |
19x – 20x | Below Average | Still reasonably attractive |
21x | Average | Market is fairly priced |
22x – 23x | Above Average | Be selective |
24x – 25x | Expensive | Consider reducing risk |
≥ 26x | Very Expensive | Stay cautious, avoid fresh exposure |
1.2 Real-Life Examples
Now let’s look at some historical examples to see how you can apply the Nifty Meter in real-world situations.
Example 1: 2008 to 2010 – From Fear to Greed
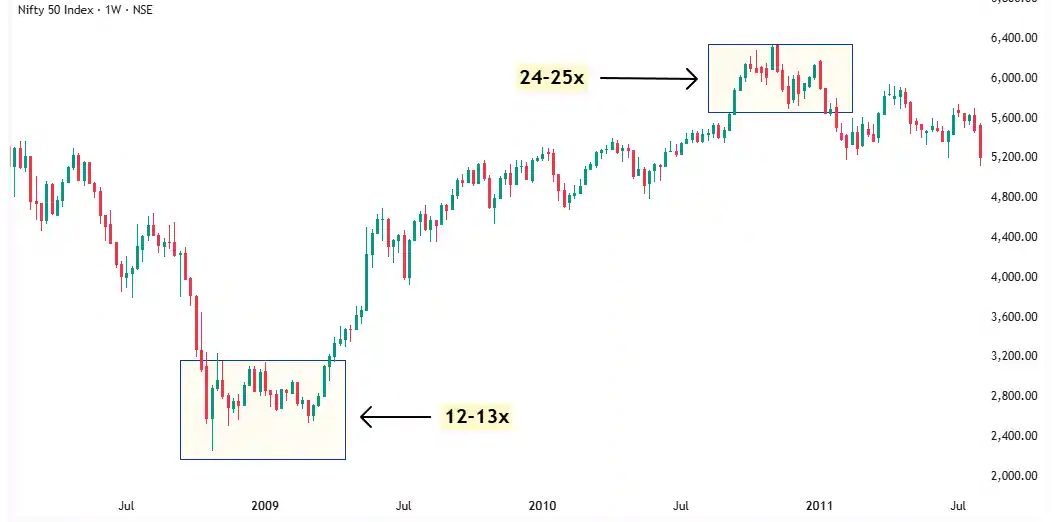
In late 2008, Nifty’s P/E fell to 12–13. Panic was everywhere. Nobody wanted to buy.
But two years later, by late 2010, the P/E shot up to 24–25. Greed was back. Stocks had doubled.
The same market — hated in fear — became loved in greed.
Example 2: 2011 to 2015 – Slow Confidence, Big Move
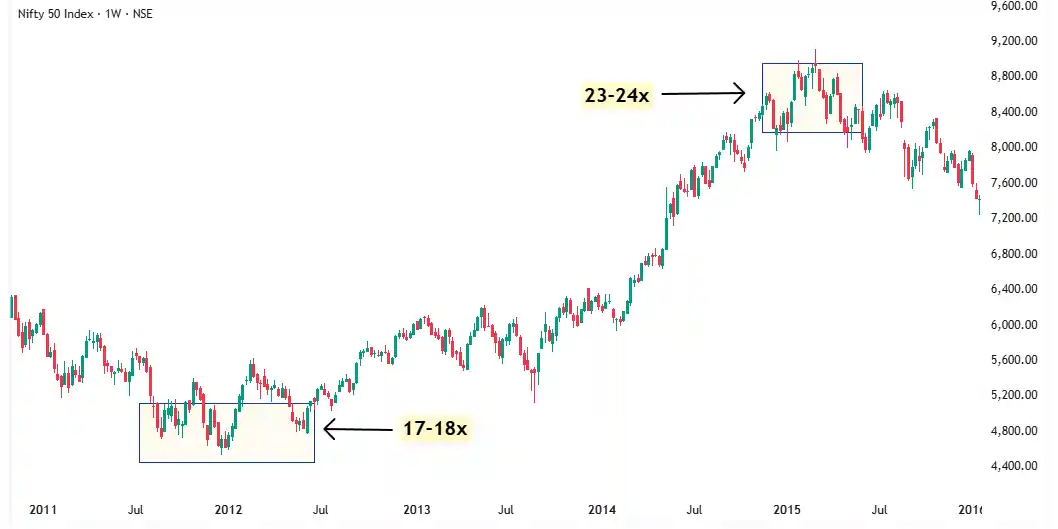
In late 2011, Nifty’s P/E was around 17–18. Fear had faded, but confidence was still low.
By early 2015, it climbed to 23–24. The mood had shifted. Optimism returned. Stocks moved up sharply.
Another cycle — quiet fear turned into loud confidence.
Example 3: 2016 to 2019 – From Hope to Hype
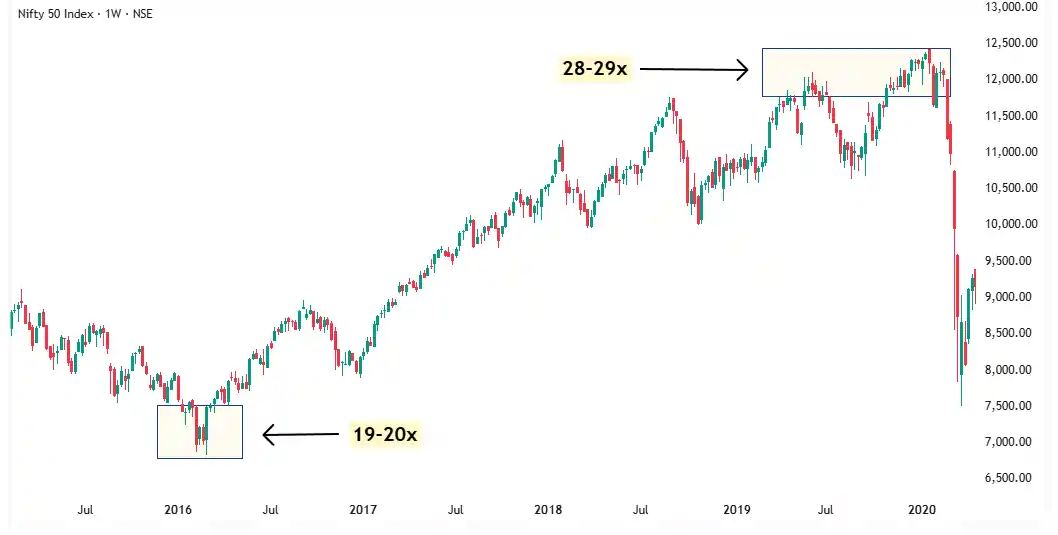
In Feb 2016, Nifty’s P/E was 19–20. Valuations were fair. Hopes were rising.
By 2019, it touched 28–29 — near bubble levels. Greed had taken over.
The market got ahead of itself. Hype replaced reason.
Example 4: 2020 to 2021 – Crash, Then Mania
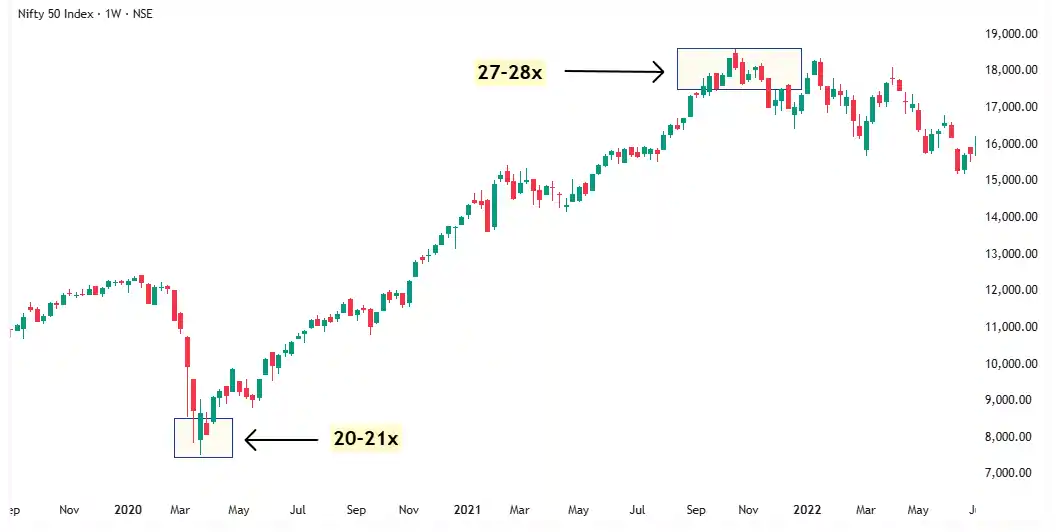
In March 2020, Covid hit. Markets crashed. Nifty’s P/E dropped to 20–21. Fear was back.
But by Oct 2021, it soared to 27–28. A full-blown bull run followed.
From panic to mania — fast and furious.
Example 5: 2022 to 2024 – War Fear to Bullish Cheer
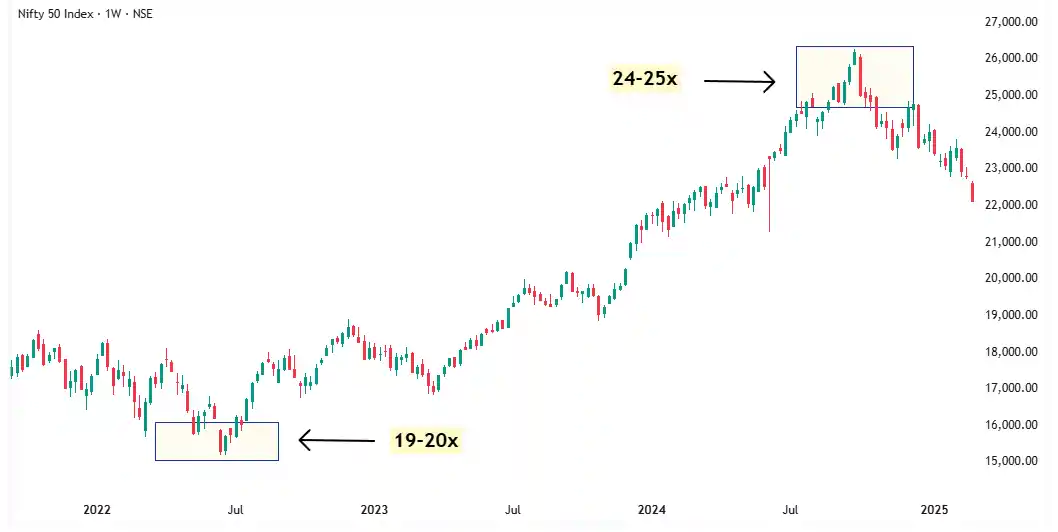
In June 2022, war, inflation, and recession fears dragged the market down. Nifty’s P/E was 19–20.
But it was the right time to enter. By Sept 2024, P/E reached 24–25. Fear faded. Bulls charged in.
Those who entered during fear, won during cheer.
1.3 What These Stories Teach You
The market runs on emotion. Fear crashes prices. Greed inflates them. But emotions change — valuations tell the truth.
The Nifty Meter cuts through the noise. When P/E is low, it shows opportunity. When P/E is high, it flashes caution.
That’s the game: Buy when others are scared. Be careful when they get too excited.
The Nifty Meter helps you stay one step ahead.
• The Nifty Meter tells you when the market is cheap, fair, or expensive — based on P/E data of Nifty 50.
• It helps you stay objective when emotions run high.
Part 2. The Cycle of Optimism and Pessimism
Stock markets don’t move in straight lines. They swing like a pendulum — from extreme optimism to deep pessimism — and then back again.
This emotional cycle plays out across every bull and bear market. And understanding it is crucial if you want to use the Nifty Meter effectively.
Let’s break it down:
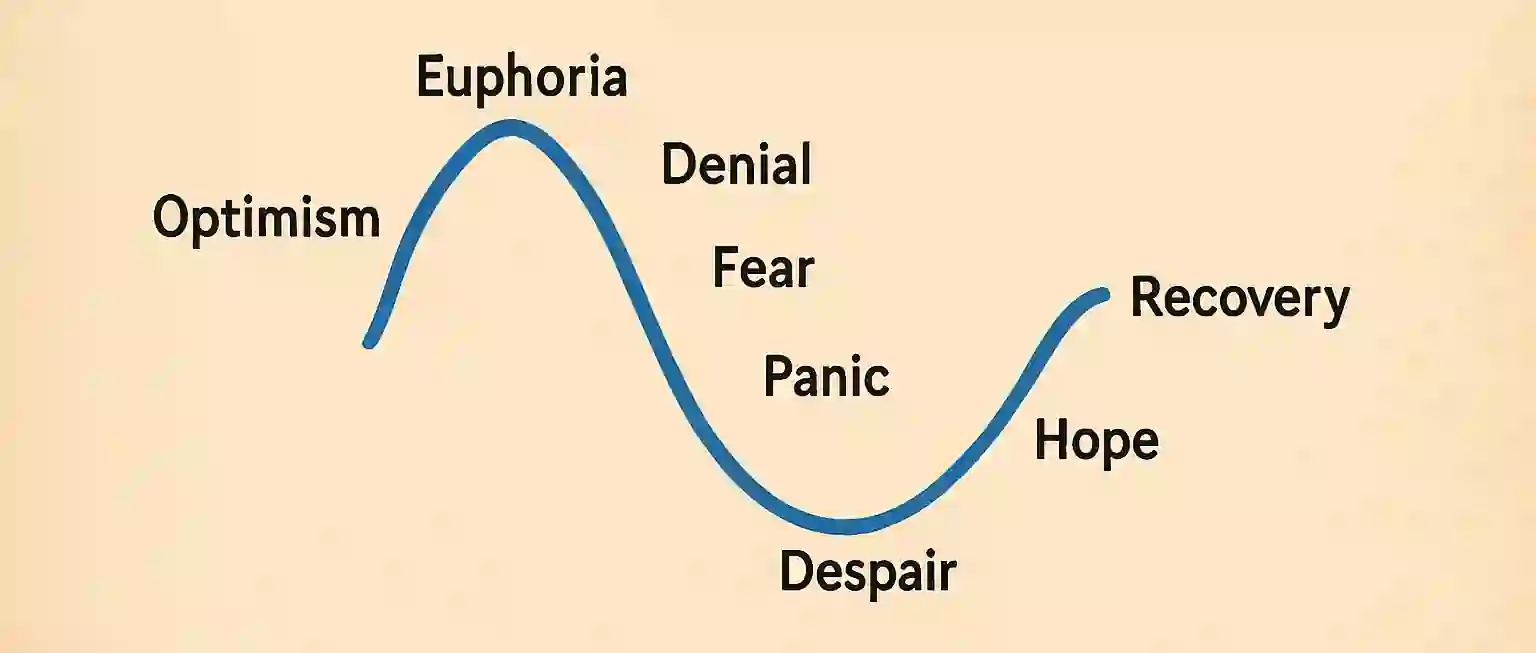
Phase 1: Optimism → Euphoria
As valuations begin to rise and the market climbs above average P/E levels, investors get excited.
They start seeing “easy money.”
Media headlines turn bullish.
Everyone’s talking about the stock market — neighbours, relatives, even your barber.
The Nifty Meter starts entering the “Expensive” zone, but nobody cares.
This is FOMO territory.
People are afraid of being left out.
They chase stocks — not because they’re undervalued, but because they’ve already gone up.
Eventually, the market enters the “Very Expensive” zone (P/E ≥ 26) — and this is when euphoria peaks.
Phase 2: Denial → Fear
Soon, cracks begin to show.
Results disappoint.
Global cues turn negative.
But investors stay hopeful.
They tell themselves: “It’s just a small dip. Buy the dip. It always works.”
But as prices keep falling, optimism turns into anxiety… then fear.
Phase 3: Panic → Despair
The Nifty crashes.
Valuations drop.
Suddenly, the P/E is back in the “Cheap” or even “Very Cheap” zone (P/E ≤ 16) — but nobody wants to buy.
This is maximum pessimism.
The same people who were shouting “buy every dip” now say “Stock market is a scam.”
They sell out at the bottom.
But quietly, smart investors begin accumulating again.
Phase 4: Hope → Recovery
Once the panic fades, fundamentals stabilize.
Slowly, prices start rising again.
Most people ignore it — they’ve been burned.
But the few who stayed patient start seeing profits.
The Nifty Meter climbs back toward “Fair Valuation.”
A new cycle begins.
2.1 What This Means for You
The Nifty Meter is not just a valuation tool.
Nifty Meter is an emotional map of the market.
- When it flashes green (Cheap) — everyone feels scared. But that’s often the best time to invest.
- When it flashes red (Expensive) — everyone feels confident. But that’s when risk is highest.
Your goal is simple: Do the opposite of the crowd. Buy when they’re scared. Be cautious when they’re greedy.
• When valuations are low, fear is high — that’s the best time to invest.
• When valuations are high, greed is high — that’s the time to be cautious.
Part 3. Why Most Retail Investors Still Get It Wrong
If the Nifty Meter is so simple…
If P/E ratios clearly show when the market is cheap or expensive…
Then why do most retail investors still lose money?
Because knowing is not the same as doing.
Most investors don’t follow logic — they follow emotions.
They buy when it feels safe — not when it is safe.
When the Nifty is cheap (P/E below 18), the headlines are scary.
Markets are falling. P&Ls are red.
Everyone around them is panicking or sitting in cash.
So they wait.
They wait for “confirmation”… for “signs of stability”…
By the time they get those signs, the market is already expensive again.
And they sell when it feels risky — not when it actually is.
When the Nifty is expensive (P/E above 24), everything looks perfect.
Stocks are going up.
Social media is bullish.
News anchors are cheering.
They don’t want to miss out.
So they hold on — or worse, they buy more — even when risk is at its peak.
This is the cruel paradox of the market:
- When risk is low, fear is high.
- When risk is high, greed is high.
And that’s exactly how most retail investors get trapped — over and over again.
3.1 What Separates Smart Investors?
They don’t follow the crowd. They follow a process.
They use tools like the Nifty Meter not just to track valuation — but to anchor their emotions.
- They accumulate when others are scared.
- They turn cautious when others get greedy.
- They think in probabilities, not predictions.
That’s the real edge.
• Retail investors follow emotions. Smart investors follow a system.
Part 4. Why You Must Avoid the News
The stock market runs on price.
But most retail investors run on news.
And that’s exactly why they lose.
Because by the time news reaches you, the move is already over.
- When the headlines say “Markets crash as recession fears rise” — the crash has already happened.
- When the headlines say “Markets soar on strong GDP numbers” — the rally is already priced in.
The news doesn’t help you anticipate the move.
It helps you react — when it’s already too late.
4.1 News Is Not Built To Make You Money.
It’s built to keep you hooked.
To stir emotions.
To create urgency, panic, greed, confusion.
Every hour, you’ll hear a new expert… a new opinion… a new prediction.
One day it’s “US inflation risk”.
Next day it’s “FII inflows surge”.
Then it’s “War fears”, “RBI rate cut”, “Budget expectations”…
But none of it tells you what really matters:
Is the market cheap or expensive?
That’s what the Nifty Meter shows you — in one glance.
No noise. No hype. No drama.
Just cold, hard valuation data — and what to do with it.
4.2 Real Money Is Made In Silence.
Smart investors aren’t glued to CNBC or Twitter.
They’re watching the data. They’re watching price. They’re watching the meter.
They don’t need a breaking headline to tell them what to feel.
Because they already have a system to tell them what to do.
And when the news finally arrives?
They’re already in… or already out.
• By the time the news reaches you, the market has already moved.
• The market reacts before the headlines come out.
Part 5. The Stock Market Is a Discounting Machine
Here’s a hard truth most people never understand:
The stock market doesn’t care about today. It cares about tomorrow — 6 to 12 months from now.
Prices don’t reflect the present. They reflect what the market believes is coming next.
That’s why the stock market is called a discounting machine.
It takes all known information — earnings, interest rates, sentiment, government policies, global cues — and compresses them into a single number: price.
If the future looks better than today, prices rise.
If the future looks worse, prices fall.
Even if, in the present, nothing has changed yet.
5.1 The Market Climbs the Wall of Worry
There’s a saying on Dalal Street:
“The market climbs a wall of worry.”
It means the market can go up even when the news is bad — as long as it believes the future will be better.
That’s exactly what happened during the second wave of the COVID pandemic.
People were dying.
Hospitals were full.
Oxygen was running out.
There was panic, fear, despair — everywhere.
And yet… the market kept going up.
Why?
Because it wasn’t reacting to the present.
It was discounting the future:
- Vaccines were being rolled out.
- Lockdowns were temporary.
- Economic activity would eventually bounce back.
- Earnings would recover in a few quarters.
While the public saw death, the market saw recovery. It was already looking 6 months ahead.
5.2 The Flip Side — When Fear Hits Before Reality
Now go back to March 2020 — the very beginning of the pandemic.
At that time, COVID hadn’t yet spread in India.
There were no mass casualties.
No full lockdowns.
Life was mostly normal.
But the market crashed.
Why?
Because it had already priced in what was about to happen:
- A global lockdown
- Travel bans
- Supply chain breakdowns
- Collapsing demand
- Sharp decline in earnings
Even before most people understood what COVID really was… the market had already reacted.
That’s how powerful this concept is.
5.3 This Is Why the Nifty Meter Works
If the market is always discounting the future…
Then valuation tools like the Nifty Meter help you stay anchored in what’s likely to happen next — not what’s happening now.
- When things look terrible but the Nifty is cheap — that’s when you accumulate.
- When everything looks great but the Nifty is expensive — that’s when you stay cautious.
Because by the time the news changes…
The price already has.
• The market doesn’t react to the present — it anticipates the future.
• That’s why prices often rise during bad news and fall before the worst begins.
Part 6. The Weakness of the Nifty Meter
The Nifty Meter is a powerful tool.
It tells you when the market is cheap.
It tells you when the market is expensive.
It helps you avoid FOMO and panic.
It helps you stay rational when everyone else is emotional.
But it’s not perfect.
Like every tool in the market — it has its limitations.
6.1 It’s Not a Timing Tool
Just because the market enters the “Very Expensive” zone doesn’t mean it will crash tomorrow.
And just because it enters the “Very Cheap” zone doesn’t mean it will bounce immediately.
Valuation extremes can stay extreme for a while.
The market can stay expensive and still go higher. The market can stay cheap and still go lower.
The Nifty Meter tells you where you are in the cycle — not when the reversal will happen.
It shows risk vs reward, not today vs tomorrow.
6.2 It Works Only at the Index Level
The Nifty Meter is based on the P/E ratio of the Nifty 50 — a group of large-cap companies.
But your portfolio might have smallcaps, midcaps, or sector-specific stocks.
So while the Nifty may look expensive, certain sectors or stocks could still be undervalued.
And while the Nifty is cheap, some frothy stocks might still deserve caution.
You need to combine the Nifty Meter with sector analysis and stock-specific research to make better decisions.
6.3 So, Should You Ignore It?
Not at all.
The Nifty Meter is like a compass.
It won’t tell you exactly when it will rain.
But it will tell you whether you’re walking into a storm or walking out of one.
Used the right way, it won’t predict the top or bottom.
But it will protect you from acting foolish at the top.
And it will give you courage to act when the bottom is near.
That’s more than what most traders ever achieve.
• The Nifty Meter shows you where you are in the cycle — but not when the turn will happen.
Part 7. The Solution: Combine the Nifty Meter with the HERO Strategy
Now you know what the Nifty Meter does.
It tells you whether the market is cheap, fairly priced, or expensive — based on long-term valuation data.
But there’s one thing it doesn’t tell you:
Which stocks to buy.
That’s where the HERO Strategy comes in.
If the Nifty Meter tells you when to go aggressive or stay cautious…
The HERO Strategy tells you where to focus your money.
Together, Nifty Meter + HERO gives you the complete system:
- The Nifty Meter tells you when the odds are in your favour.
- The HERO Strategy finds stocks worth betting on.
- And the pyramiding method (inside HERO) shows you how to scale into winners without taking excess risk.
The HERO Strategy is like a compass that helps you find strong stocks — even in stormy markets.
7.1 Timing the Market Is Hard. But Stacking the Odds? That’s Smart.
Most people try to predict the market.
Smart investors focus on probabilities.
By combining market-level valuation (Nifty Meter) with stock-level strength (HERO), you:
- Avoid emotional trades
- Stay out during euphoric bubbles
- Load up when the crowd is scared
- And build conviction in high-quality stocks during the right cycles
It’s not about catching the top or bottom.
It’s about making high-quality decisions over and over again — with a repeatable process.
That’s how real money is made.
• The Nifty Meter tells you when to act.
• The HERO Strategy tells you where to act.
• Together, they give you clarity, confidence, and control.
Conclusion: Invest with Logic, Not Emotion
Most people enter the stock market with hope.
But hope isn’t a strategy.
They buy when it feels good.
They sell when it feels scary.
And they repeat this cycle until their confidence — and capital — runs out.
But you don’t have to be one of them.
You now have two tools that can anchor your decisions:
- The Nifty Meter keeps you grounded in reality — not headlines, not hype.
- The HERO Strategy helps you find stocks with real strength — not just stories.
Together, they cut through the noise and give you a clear edge.
No more blind bets.
No more panic moves.
No more chasing tips or headlines.
Just a simple, data-backed system to help you take control — and stay in control.
The market will always test you.
But now, you have a strategy to fight back — with logic, discipline, and confidence.
Use it well.
🟠 Still Have a Doubt? Let’s Solve It Together.
Learning is powerful — but asking the right questions is what turns knowledge into results.
 Confused about something you just read? Not sure how to apply it to your trading journey?
Most traders stay stuck because they never ask. Don’t be one of them.
Ask me directly here — and I’ll personally help you move forward.