Understanding The Candlesticks

By Sachin Malik
There are thousands of articles, books, and YouTube videos on candlesticks.
Everyone’s talking about marubozu, shooting stars, morning stars, dojis—and what not.
So, what’s new to learn here?
The truth.
These fancy names often create more confusion than clarity.
The more candlestick patterns you memorize, the less money you make.
It becomes noise. Not insight.
This article is different.
My goal is to simplify candlesticks for you.
You won’t need to remember dozens of patterns.
You’ll get a fresh perspective—what actually works, and what popular advice you should ignore.
Part 1. Birth of a Candle

Let’s say the market opens at ₹100.
It drops to ₹98, then shoots up to ₹107, and finally closes at ₹105.
You now have four key data points:
- Open – ₹100
- Low – ₹98
- High – ₹107
- Close – ₹105
These four values—Open, High, Low, Close (OHLC)—are all you need to create a candlestick.
If the close is higher than the open, it forms a green candle.
If the close is lower than the open, it’s a red candle.
The difference between the open and close is the body of the candle.
The thin lines above and below?
That’s the wick—it shows how high and low the price went during the day.
Part 2. What does a Candlestick Represent?
A candlestick shows the buying and selling activity of traders.
That’s it.
Nothing more. Nothing less.
When the market opens, traders start buying and selling. This pushes the price up and down.
The candlestick captures this action.
It’s a visual snapshot of buying vs. selling pressure.
So, a candlestick represents buying and selling pressure.
And if you look closely, you can read the psychology of traders through it.
Let’s break it down with examples:

Example 1:
Market opens at ₹100.
It rises slightly to ₹103. Then selling starts. Price drops to ₹90.
If the market closes at ₹90, it forms a strong red candle (O=100, H=103, L=90, C=90).
This shows strong selling pressure.
But what if something changes in the second half?
Good news comes in. Traders start buying. Price climbs back up.
If it closes at ₹102, the green candle (O=100, H=103, L=90, C=103) now shows buying pressure—even though it was once deep in red.
Psychology changed. And the candle captured it.

Example 2:
Market opens at ₹100.
It drops to ₹97, then buyers step in. Price jumps to ₹110.
If it closes at ₹110, you get a strong green candle (O=100, H=110, L=97, C=110).
Clear sign of strong buying pressure.
But now imagine bad news hits.
Traders panic. Selling begins.
Price crashes from ₹110 to ₹98 and closes there.
Now that same candle turns into a red candle (O=100, H=110, L=97, C=98), showing selling pressure.
Candlesticks are not just patterns. They’re a window into the trader’s psychology.
2.1 Bigger The Candle, Stronger The Signal

If the market opens at ₹100, drops to ₹99, then rallies to ₹104 and closes at ₹103 — it forms a green candle.
This shows buying pressure because traders were aggressively buying.
Now imagine the same day, instead of making a high at ₹104, it makes a high of ₹120 and closes at ₹118.
This candle is much bigger than the previous one, and it indicates huge buying pressure.
A big candle represents huge buying pressure, and a smaller candle represents small buying pressure.
The bigger the candle, the more powerful the message.
The same logic is true for red candles also. A bigger red candle means huge selling pressure.
2.2 A Common Misconception
Most people think a green candle means buying pressure and a red candle means selling pressure.
But that’s not always true.

Let’s say the market opens at ₹100, jumps to ₹110, then drops to ₹99, and finally closes at ₹102.
Since the close is above the open, it forms a green candle.
But does it show buying pressure?
Not really.
The price crashed from ₹110 to ₹102 — that’s selling pressure, not buying.
You can’t judge a candle by its colour alone. You have to study the entire candle.
The move from ₹100 to ₹110 shows early buying, but the fall to ₹102 shows the real story — sellers took control.
Despite the green colour, this candle shows selling pressure.
Now take another example.
The market opens at ₹100, falls to ₹90, then rallies to ₹101, and closes at ₹98.
It forms a red candle — but look closely.
From ₹90 to ₹98, the price climbed. That’s buying pressure, even if the candle is red.
So remember — don’t trust the colour. Trust the full story.
The close matters more than the open. The tail tells the truth.
• A candlestick represents buying pressure or selling pressure.
• The bigger the candle, stronger the pressure.
• A green candle can still mean selling pressure — and a red candle can show buying pressure.
Part 3. How Candles Help You in Trading
Candles help you identify the change in psychology of traders.
Once you spot that change, you can anticipate what they might do next — and that gives you an edge.
For example, if a stock has been rising for a few days and you see a candle showing selling pressure, it means the psychology has shifted.
Sellers are stepping in.
The price will most likely go down.
Notice I said most likely, not definitely — I’ll explain the difference later.
Let’s look at an example.
Example 1:

A stock is falling. Candles 1, 2, and 3 show selling pressure — price keeps going down.
Then Candle 4 opens. But instead of falling, it rises and closes near the high.
This signals strong buying pressure.
So earlier, the mood was bearish (Candles 1–3). Now, Candle 4 shows a shift — traders have turned bullish.
Once psychology shifts, the trend often changes too.
Candles 5 and 6 confirm this — the stock starts rising.
By reading candles and spotting this shift in psychology, you can anticipate the next move.
Real life example:
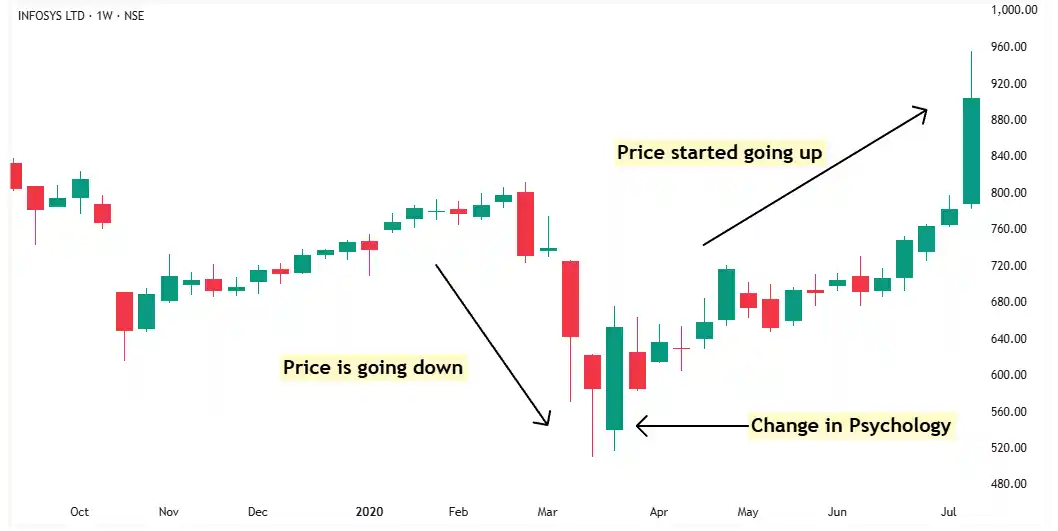
Same setup — price is falling, then a bullish candle forms, showing strong buying pressure.
That marks the psychological shift.
After that, the price goes up.
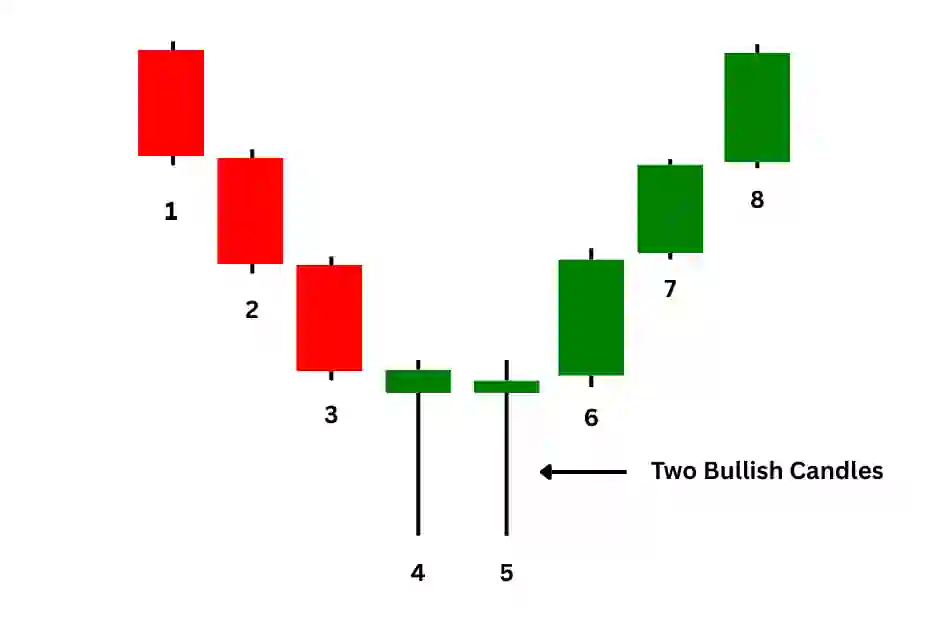
Example 2:

Candles 1, 2, and 3 show strong selling pressure — price keeps falling.
Then comes Candle 4.
It opens and starts falling again, continuing the downtrend. But later in the day, buyers step in and push the price up.
This shift shows buying pressure — a clear sign that psychology is changing.
Candles 5, 6, and 7 confirm it — the stock starts rising.
Candle 4 was the turning point where the mood flipped from bearish to bullish.
Real-life example:

Same pattern — price was falling, then a bullish candle formed.
It signaled a shift in the trader’s psychology.
After that, the stock moved up.
Example 3:

Candles 1, 2, and 3 show strong buying pressure — the stock is in an uptrend.
Then comes Candle 4.
It opens normally and moves higher, but by the end of the day, sellers take control and push the price down.
This shift signals a change in trader psychology — from bullish to bearish.
Candles 5, 6, and 7 confirm the new sentiment as selling pressure builds and the stock starts a downtrend.
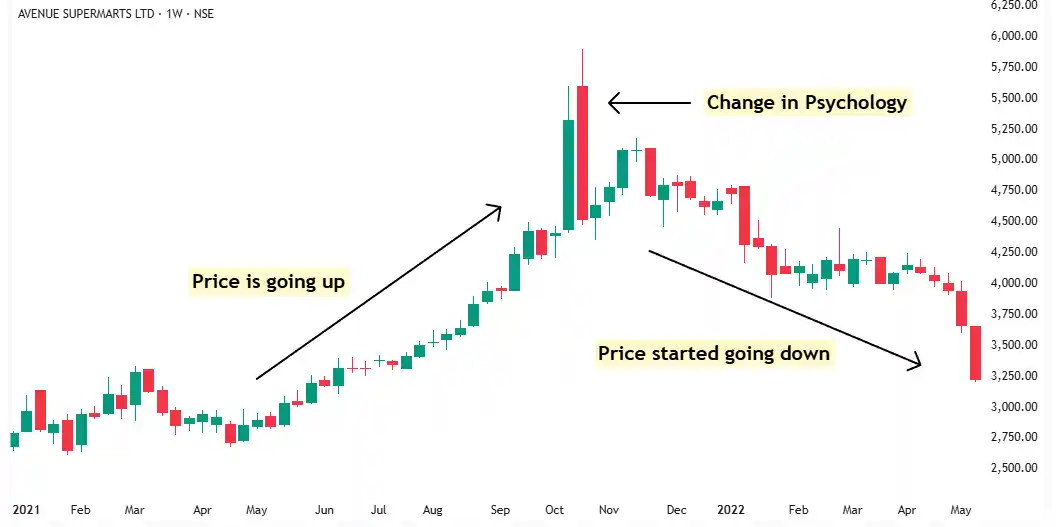
Real-life example:

Same pattern — the stock was rising, then a bearish candle appeared.
It marked the psychological shift.
After that, the price started falling.
Example 4:

The stock is in an uptrend — Candles 1, 2, and 3 are green, showing strong buying pressure.
Then Candle 4 opens and immediately drops, forming a red candle.
This signals selling pressure.
This shift shows that trader psychology has changed. The uptrend is likely over, and a downtrend may begin.
Real-life example:
Same setup — price was rising, then a bearish candle appeared.
It marked a clear change in sentiment.
After that, the stock started falling.
These examples show how candlesticks reflect changes in trader psychology.
By observing how the candles form — especially at key turning points — you can get a sense of what traders might be thinking.
Now, let’s clear up some popular myths about candlesticks.
Candlesticks are powerful — but they’re also misunderstood.
Let’s break down a few common myths traders often fall for.
Part 4 - Debunking Myths: #1 Candlesticks Cause Price Moves
In the previous examples, you saw that when a green candle formed, price went up.
And when a red candle formed, price went down.
This might lead you to believe that the candlestick caused the move.
But that’s a myth.
Candlestick is not the cause — it’s the effect.
It’s just a visual summary of trader activity during that time.
Traders buy and sell based on many different reasons — earnings expectations, news, insider activity, or geopolitics.
The candlestick simply shows what happened as a result of all that action.
Example: KPI Green

There was a big breakout candle, and price surged after that.
But the candle wasn’t the reason behind the move.
I was buying that day — not just because of the candle, but because the company had a strong order book and solid growth potential. I believed earnings would rise in the future.
Other traders might’ve had their own reasons — maybe a news update or a fundamental reason.
The candlestick just captured the outcome of all our decisions.
Remember: Price doesn’t move because of the candlestick. The candlestick forms because of the price movement.
Part 5 – Debunking Myths: #2 A Candle Means Price Will Go Up
In the earlier examples, you saw that after a bullish candle (buying pressure), the price often went up.
This might make you believe that every time a bullish candle forms, price will go up.
But that’s not true.
In fact, that’s a dangerous mindset.
A candlestick shows you what may happen next — not what will happen next. It’s not a guarantee. It’s just a signal.
You should never treat a candlestick as certainty. You should treat it as a probability.
Example:
Let’s say a stock is falling, and then a bullish candle appears.
It signals a possible shift — maybe the downtrend is ending.
You expect price to go up. But then something unexpected happens — maybe bad news or a weak earnings report — and sentiment changes again.
Sellers come back, and price starts falling.
The candle didn’t lie.
It showed you the current psychology — not the future outcome.
When you see strong buying pressure, it tells you what traders are feeling right now.
But the future is uncertain.
Anything that shifts trader psychology again can reverse the move.
So when you see a bullish candle, don’t say,
“Price will go up.”
Instead, say,
“There’s a high probability price may go up.”
There’s a big difference.
The first statement assumes certainty. The second one respects reality.
Trading is a game of probabilities.
If you treat candlesticks as guarantees, you’ll be wrong often.
But if you treat them as probabilities, you’ll think like a smart trader.
Part 6 – Debunking Myths: #3 You Can Make Money Using Candlesticks Alone
When I first entered the stock market, I discovered candlestick patterns — and I thought I had found the holy grail.
A green candle meant price would go up.
A red candle meant price would fall.
Simple, right?
I was convinced I could make money using just candlesticks.
If you’re thinking the same — I get it. I’ve been there.
But here’s the truth: That belief is based on Myth 1 and Myth 2.
Myth 1 makes you think price goes up because of the candle. Myth 2 makes you think price will go up for sure after a bullish candle.
Put them together, and it’s easy to fall for the biggest myth of all:
That candlesticks alone are enough to make money in the market.
Sorry to burst the bubble — but that’s just not how it works.
If it were that easy, everyone reading candlestick charts would be a millionaire by now.
But they’re not.
Why?
Because the market is more complex than just red and green bars.
Candlesticks are useful. They show the psychology of traders.
But they only tell part of the story.
To make real money in the stock market, you need more than candlestick patterns.
You need a complete strategy — something that combines psychology, technicals, fundamentals, and macro analysis.
I’ve already shared the complete HERO strategy with you — a system built on timeless principles, not shortcuts or gimmicks.
Use it.
Candlesticks are one piece of the puzzle — HERO strategy gives you the full picture.
• Myth #1: Candlesticks move the price – they don’t, they just reflect it.
• Myth #2: A green candle means price will go up – not always true.
• Myth #3: You can make money using candles alone – you need a full strategy.
Part 7. Avoid Using Candlestick Names
If you search for “candlestick patterns” online, you’ll find dozens of names — Marubozu, Hammer, Morning Star, Shooting Star, and so on.
It sounds impressive.
It looks like you’re learning.
But the truth is — it’s just noise.
These fancy names don’t give you any extra edge. In fact, they often create more confusion than clarity.
Let’s look at an example.

This is a chart of Reliance.
- On the left, there’s a Marubozu pattern on a 4-minute chart.
- On the right, there’s a Hammer pattern on an 8-minute chart.
Now let’s break them down:
- Before both candles, the price was falling.
- Then, a candle forms — strong body, clear reversal.
- After that, the price starts going up.
So what do both candles represent?
Buying pressure.
That’s it.
Whether you call it Marubozu or Hammer — you’re seeing the same thing: Buyers stepped in. Sentiment changed. Price reversed.
So here’s the question: If both patterns mean the same thing, why do you need two names?
You don’t.
What to do instead?
Forget the names. Forget the memorization.
Just focus on this one simple question: Is there buying pressure or selling pressure?
Because that’s all a candlestick really shows.
Every candle on the chart is just telling you one thing —Who’s in control right now: buyers or sellers?
That’s what matters.
Trying to memorize dozens of patterns and names only clutters your thinking. It looks like progress, but it’s actually a distraction.
Don’t trade like a textbook. Trade like a real thinker.
Read the story behind the candle — not the name.
That’s how you simplify your analysis and sharpen your edge.
Part 8. Avoid Short Time Frames
Candlesticks on short time frames like 5, 10, or 15 minutes are highly unreliable.
Why?
Because most intraday trading today is done by algorithms.
These algos identify patterns faster, execute trades instantly, and cause rapid price fluctuations.
You can’t beat them at their own game.
That’s why signals on short time frames are noisy and inconsistent.
Trying to trade based on a 5-minute candlestick is a losing strategy.
Remember this rule: The shorter the holding period, the harder it is to make money. The longer the holding period, the easier it becomes.
If you want reliability, use candlesticks on higher time frames.
For the HERO strategy, the weekly chart is ideal.
Daily charts can still be noisy, and monthly charts are better suited for long-term investing, not trading.
So if you’re serious about making better trading decisions — ditch the 5-minute noise and start thinking weekly.
Part 9. When Market Tells You The Same Thing Twice, Pay Attention.
Let’s say the stock is in a downtrend.
Then suddenly, you spot a candle showing strong buying pressure.
That’s your first clue — maybe the psychology has shifted. Maybe the downtrend is over.
Then comes another candle with similar buying pressure.
Now the market has repeated itself.
Same signal. Twice.
That’s not a coincidence. That’s confirmation.
When the market tells you the same thing twice, it’s speaking loud and clear.
The probability of a trend reversal just went up.
Example 1:
The stock was falling until Candle 3.
Candle 4 showed clear buying pressure — a possible turning point.
Then Candle 5 confirmed it with another bullish candle.
Now you have two signals. Same message.
It’s powerful.
The market is telling you the probability of price going up is much higher.
It has confirmed the shift by repeating the same message twice.
After that, the price started going up.
Listen when the market repeats itself. It’s trying to help you.
Example 2:

The price was in an uptrend until Candle 3.
Then Candle 4 appeared — the first bearish candle showing selling pressure.
Now the uptrend might be over. A downtrend could be starting.
Then comes Candle 5 — another bearish candle.
Same message. Second time.
Now you should really pay attention. The probability of a trend reversal has increased.
When multiple candles in the same area tell you the same thing, don’t ignore it.
It’s a powerful signal.
The market is giving you confirmation. Now, the downtrend is ready to begin.
The market rarely repeats without a reason. Two identical signals mean the tide is turning. Pay attention — hesitation can cost you.
Part 10. A Big Candle + More Buying Pressure = Powerful Combo
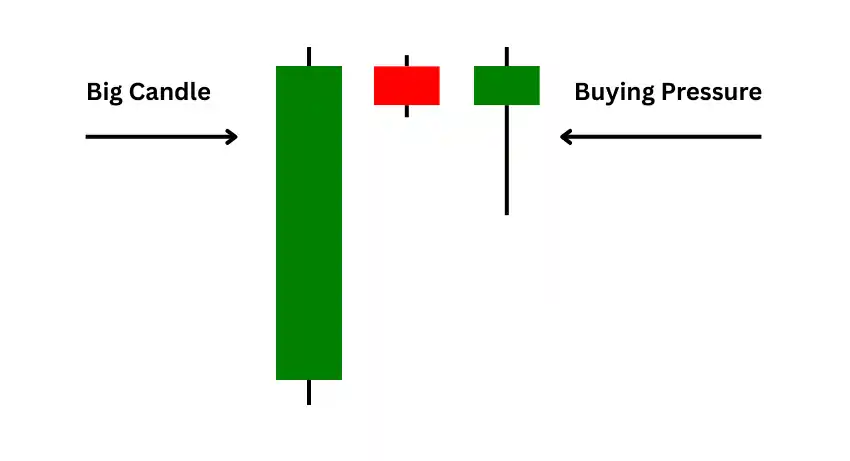
Let’s say the market forms a big green candle — strong, wide, and full of buying pressure.
After that, price goes sideways or dips slightly.
Then comes another candle where buyers step in again and push the price up by the close.
That’s a second wave of buying pressure.
Now the market has told you the same thing twice: First, with a big candle. Then, with a bounce after a dip.
That’s not random — it’s a powerful combo.
When a big green candle is followed by another candle showing buyer strength after a pullback, the probability of price going up increases sharply.
Example 1:

The stock makes a big, strong green candle — clear sign of aggressive buying.
After that, the price dips slightly, nothing major.
Then it falls a bit more, but buyers step in again and push the price up by the close. That candle shows renewed buying pressure.
Now you’ve got two strong signals — one big candle, and one bounce after a dip.
This combo clearly shows: buyers are in control — and the stock is likely to go up from here.
Example 2:

A big green candle represents strong buying pressure.
Then the stock dips, but buyers step in and push it higher — forming another candle that also shows buying pressure.
Now the market has told you the same thing twice — and that’s already a powerful combo.
Then it happens again.
Price drops, but once more, buyers step in and lift it, forming a third bullish candle.
Now the market has said it three times — and that’s rare.
At this point, the market is yelling: “Price is about to go higher.”
With this much buying pressure, it has no other choice.
• Forget candlestick names — focus on buying or selling pressure.
• Short time frames are noisy — stick to weekly charts.
• Same signal twice = confirmation — don’t ignore it.
• A Big Candle + More Buying Pressure = Powerful Combo
Conclusion
Candlesticks are a powerful way to read market psychology.
They show you when buyers take control, when sellers are stepping in, and when psychology is changing.
You don’t need to memorize patterns — just focus on buying pressure and selling pressure, not the name of the candle.
Keep Learning
Next Lesson: Dow Theory