You can still lose money if you enter at the wrong time.
Buy too late, and the trend is already over. Sell too late, and you give back all your profits — or worse, end up with a loss.
And it’s not just painful — it’s demoralizing.
You spend hours researching, watching charts, following news… and still end up on the wrong side of the trade.
You feel like you’re always late.
Always trapped.
Always reacting after the move is done.
But there’s a simple fix.
Learn how to identify the trend. That’s exactly what Dow Theory teaches you.
This classic market framework shows you when an uptrend is beginning — so you can ride the wave early.
And it warns you when a downtrend is starting — so you can get out before the damage hits.
Dow Theory is one of the most underrated tools in trading — and one of the most powerful for staying on the right side of the market.
Part 1. Building Blocks of Dow Theory
When the price moves upward and then starts falling, the highest point before the fall is called a swing high.
When the price moves downward and then starts rising, the lowest point before the rise is called a swing low.
These swing highs and swing lows are the building blocks of Dow Theory.
Swing highs and swing lows are the turning points in the market.
By identifying these points, you can trace the path the market is taking.
Once you’ve marked the swing highs and swing lows on a chart, identifying whether the market is in an uptrend or downtrend becomes much easier.
1.1 Turning Points
When the price is going up and then turns downward, that point is called a turning point. I’ve marked the first one as TP1.
Then, the price stops falling and starts rising again — that’s another turning point, marked as TP2.
In the same way, I’ve marked all the key turning points on the chart.
Identifying a trend is simply about identifying these turning points.
If you can spot them, you can clearly see whether the market is trending up or down.
Now, let’s label these points as swing highs and swing lows.
1.2 Swing Highs (SH) And Swing Lows (SL)
Let’s say the price is going up and then turns downward — that turning point is called a swing high, because the price reaches a high and then starts falling.
Similarly, if the price is going down and then turns upward, that point is called a swing low, because the price hits a low and then starts rising.
You can mark all turning points on the chart as either swing highs or swing lows:
– If the price starts falling after the turning point, it’s a swing high.
– If the price starts rising after the turning point, it’s a swing low.
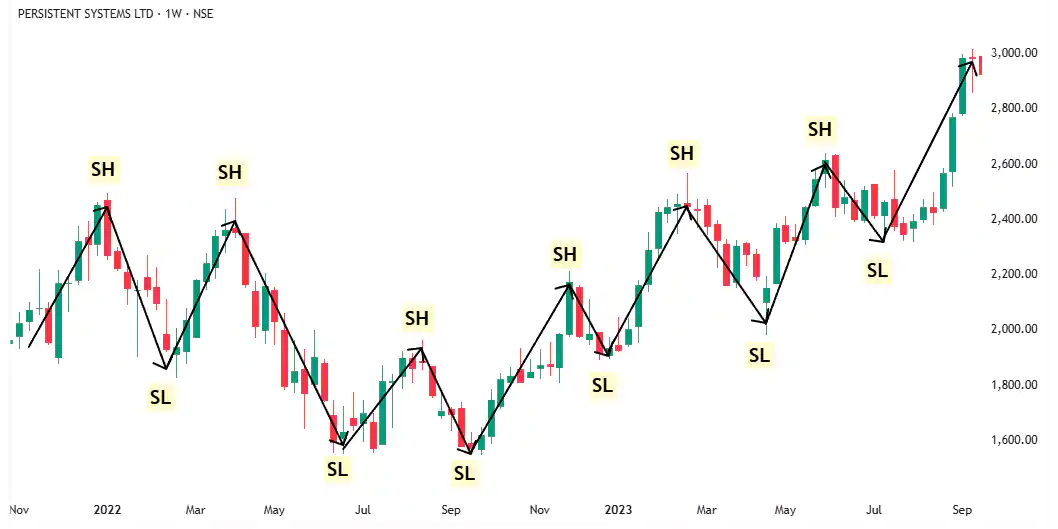
1.3 Real-Life Example
I’ve marked all the turning points on the chart.
Then, I’ve labeled each one as either a swing high or a swing low, based on the direction the price moved after that point.
Part 2. How to Identify a Trend
There are three types of trends:
Uptrend
Downtrend
No trend
At any given point, a stock will be in either an uptrend, downtrend, or no trend.
When the stock is in neither uptrend nor downtrend, you can also call it a sideways market or range-bound market — but I will simply call it no trend, because the stock is not in any clear direction.
To identify a trend, you have to further divide swing highs into higher highs and lower highs, and swing lows into higher lows and lower lows.
Swing high → higher highs and lower highs
Swing low → higher lows and lower lows
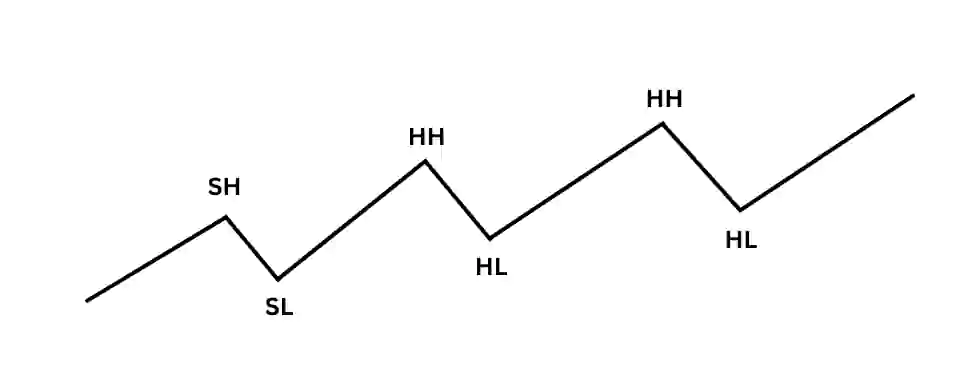
2.1 Uptrend
Let’s say a stock is going up and then starts falling — that’s your first swing high (SH).
Then the price stops falling and starts rising again — that’s your swing low (SL).
Now, if the price rises above the previous swing high, you don’t just call it another swing high — you call it a higher high (HH), because it’s higher than the last one.
Next, the price falls again but doesn’t go as low as the last swing low. It turns back up before that. This new turning point becomes a higher low (HL).
If this pattern of higher highs and higher lows forms, the stock is in an uptrend.
2.2 Downtrend
Let’s say a stock is going down and then starts going up — that’s your first swing low (SL).
Then the price stops rising and starts falling again — that’s your swing high (SH).
Now, if the price drops below the previous swing low, you don’t just call it another swing low — you call it a lower low (LL), because it’s lower than the last one.
Next, the price rises again but doesn’t go as high as the previous swing high. It turns back down before that. This new turning point becomes a lower high (LH).
If this pattern of lower highs and lower lows forms, the stock is in a downtrend.
2.3 No Trend
Let’s say a stock is going up and then turns down — that point is your first swing high (SH).
The price then stops falling and moves up again — mark that point as your swing low (SL).
Next, the price rises above the previous SH — that’s a higher high (HH). Up to here, the stock is in an uptrend.
Now the price drops below the previous SL — this is a lower low (LL).
When you see both a HH and LL, the stock is in No trend. The stock is in a range or sideways market — neither up nor down.
Then the stock forms a lower high (LH) followed by a higher low (HL). As long as you see LH and HL, the market remains sideways.
A clear trend returns only when you see:
HH and HL → stock is in an uptrend
LH and LL → stock is in a downtrend
• Higher highs (HH) and higher lows (HL) means Uptrend.
• Lower highs (LH) and lower lows (LL) means Downtrend.
• Higher high (HH) lower low (LL) or lower high (LH) higher low (HL) means No Trend.
Part 3. How Dow Theory Helps You In Trading
Dow Theory helps you do one thing really well — identify trends and trade with them.
You:
Buy when a new uptrend begins
Ride the trend while it lasts
Sell when a downtrend starts
Simple.
No predictions.
Just reacting to what the chart is telling you.
3.1 How Trends Transition
But before applying Dow Theory, you must understand how trends transition — because markets don’t move in a straight line.
In most cases:
Uptrend → No Trend → Downtrend Downtrend → No Trend → Uptrend
Yes, sometimes an uptrend may directly flip to a downtrend — but usually, it first loses momentum (no trend), and only then reverses.
This transition zone is where most traders get trapped. They expect the trend to continue — but the market has already changed character.
What You Need to Focus On
Don’t just chase trends — spot the shift before the crowd does:
Uptrend losing steam? Get cautious.
Downtrend stalling? Prepare for a reversal.
Sideways market? Watch for breakout or breakdown.
The faster you recognize the transition, the better your trades.
Let’s learn how to identify these trend transitions one by one.
Part 4. Birth of a No Trend
Before a stock transitions from an uptrend to a downtrend, or from a downtrend to an uptrend, it usually enters a sideways phase.
This is known as a “no trend” zone.
It’s a transition period where the market loses momentum and stops following a clear trend structure.
There are two ways a no trend can begin.
4.1 Uptrend to No Trend
In an uptrend, the stock keeps making Higher Highs (HH) and Higher Lows (HL).
But if the price falls below the previous Higher Low (HL), a new Lower Low (LL) is formed.
This breaks the uptrend structure.
The uptrend is now over because the stock is no longer making HL.
However, a downtrend hasn’t started either because the stock has not yet made a Lower High (LH).
So right now, the stock is not in an uptrend or a downtrend. It is in no trend.
This is the birth of a no trend after an uptrend.
Real life example:
4.2 Downtrend to No Trend
In a downtrend, the stock keeps making Lower Highs (LH) and Lower Lows (LL).
But if the price rises above the previous LH, a new Higher High (HH) is formed.
This breaks the downtrend structure.
The downtrend is now over because the stock is no longer making LH.
However, an uptrend hasn’t started either because the stock has not yet made a Higher Low (HL). So the stock is in no trend.
This is the birth of a no trend after a downtrend.
Real life example:
In summary, when a trend breaks but the opposite trend hasn’t formed yet, the stock enters a no trend phase.
This is a sideways zone, and many traders find it difficult to navigate because there’s no clear direction.
Part 5. Birth of an Uptrend
The birth of an uptrend is a powerful moment.
It brings hope — hope to ride a fresh trend, hold it long, and turn it into profit.
An uptrend begins when the stock starts making both Higher Highs (HH) and Higher Lows (HL).
But before that happens, the stock may either be in a sideways phase (no trend) or in a downtrend. That means there are two ways an uptrend can begin:
When the stock transitions from No Trend to Uptrend
When the stock transitions from Downtrend to Uptrend
Let’s understand both cases one by one.
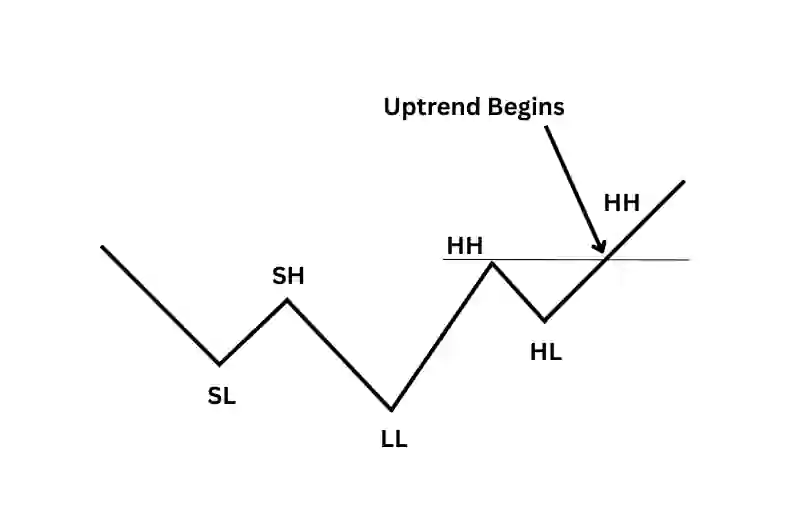
5.1 No Trend to Uptrend
In this case, the stock was previously in a sideways phase. It wasn’t making Higher Highs (HH) or Lower Lows (LL). It was simply moving in a range with no clear direction.
At some point, the price starts rising and breaks above the previous swing high (SH).
This breakout creates a new Higher High (HH).
But a single HH doesn’t confirm an uptrend.
What confirms it is when the price pulls back and then forms a Higher Low (HL). If the stock then goes on to break the previous HH, it has now created both HL and HH — which confirms the start of an uptrend.
The moment both HL and HH are visible on the chart, the sideways market ends and a new uptrend is officially born.
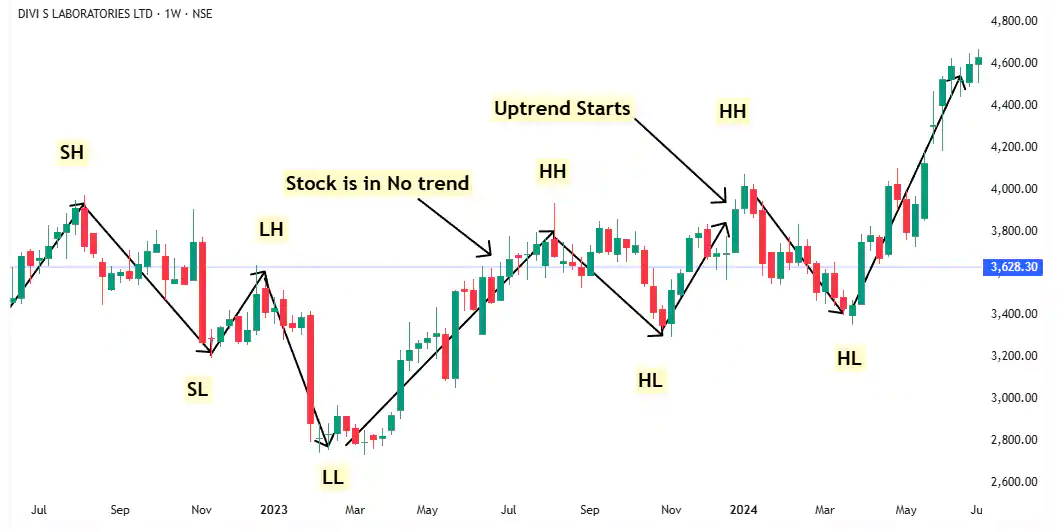
Real life example:
5.2 Downtrend to Uptrend
In this case, the stock was in a clear downtrend — it was making Lower Highs (LH) and Lower Lows (LL).
Then, at one point, the price stops falling and begins to rise.
Before making a new Higher High (HH), the stock had already formed a Higher Low (HL).
So when it breaks above the previous Lower High (LH) and creates a HH, it now has both HH and HL on the chart.
This means not only is the downtrend over, but a fresh uptrend has officially started.
Real life example:
Part 6. Birth of a Downtrend
The birth of a downtrend is the moment hope dies.
What looked like a small pullback turns into the first signs of weakness — and then, the cracks become a collapse.
This is where uptrends end, and the smart money starts exiting.
A downtrend can begin in two ways:
When a stock moves from no trend to downtrend
When a stock moves from an uptrend to downtrend
6.1 No Trend to Downtrend
When you first see a Lower Low (LL), it means the uptrend is over and the stock has entered a non-trending phase.
Then it goes up a little and starts falling again. This time, it forms a Lower High (LH).
The moment it breaks below the previous LL, the downtrend has started.
Now you have both LH and LL — this is the beginning of a confirmed downtrend.
If you’re holding the stock, it’s time to sell and move on.
Real life example:
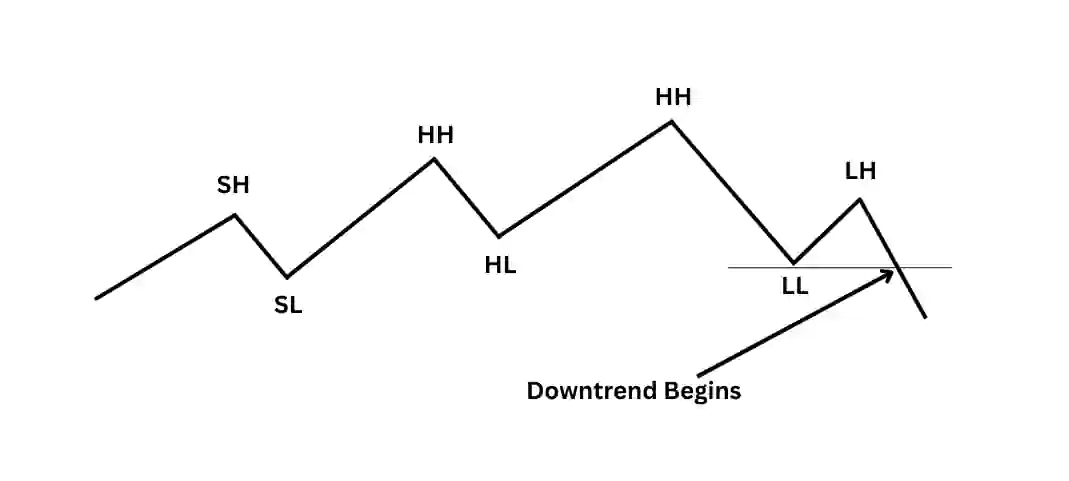
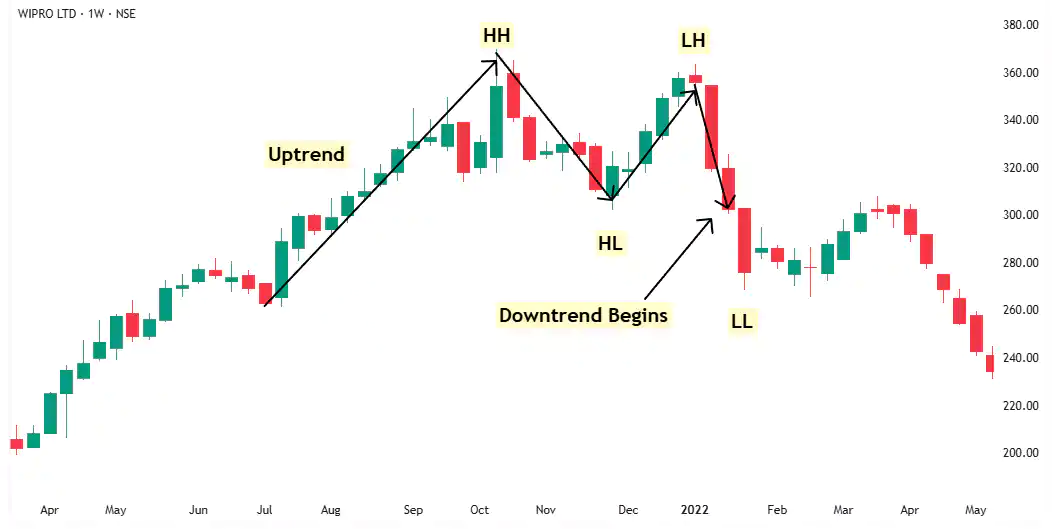
6.2 Uptrend to Downtrend
The stock was in a clear uptrend until the second Higher Low (HL).
Then it goes up, but fails to make a new Higher High (HH) and starts falling.
As soon as it breaks below the low of the previous HL, a Lower Low (LL) is formed.
Now it has both Lower High (LH) and LL, which means the uptrend has shifted to a confirmed downtrend.
Real life example:
Quick Guide
Part 7: Weakness of Dow Theory
Dow Theory is a powerful tool.
It helps you identify trends early, ride them with confidence, and exit before the damage.
But no tool is perfect.
There’s one weakness in Dow Theory that every trader must understand.
Sometimes, the price makes a Lower High (LH) and a Lower Low (LL) — and still goes up.
It looks like a new downtrend has started… but it hasn’t.
This usually happens during a complex correction inside an uptrend.
7.1 What is a Complex Correction?
In a simple correction, price goes from Point A to Point B and then resumes the uptrend.
But in a complex correction, price forms multiple legs —
It falls to Point 1 (a new low),
Bounces to Point 2 (a lower high),
Then falls again to Point B, forming a Lower Low (LL).
According to Dow Theory, this structure (LH and LL) indicates a downtrend.
But here’s the catch — it’s not a real downtrend.
It’s just a deep correction.
And the moment it ends, the stock explodes upward.
If you rely only on Dow Theory, you’ll exit the trade at Point B — thinking the uptrend is over.
But in reality, the bigger uptrend is still intact.
This is a classic trap.
Many traders get shaken out, only to watch the stock take off without them.
Let’s look at real examples.
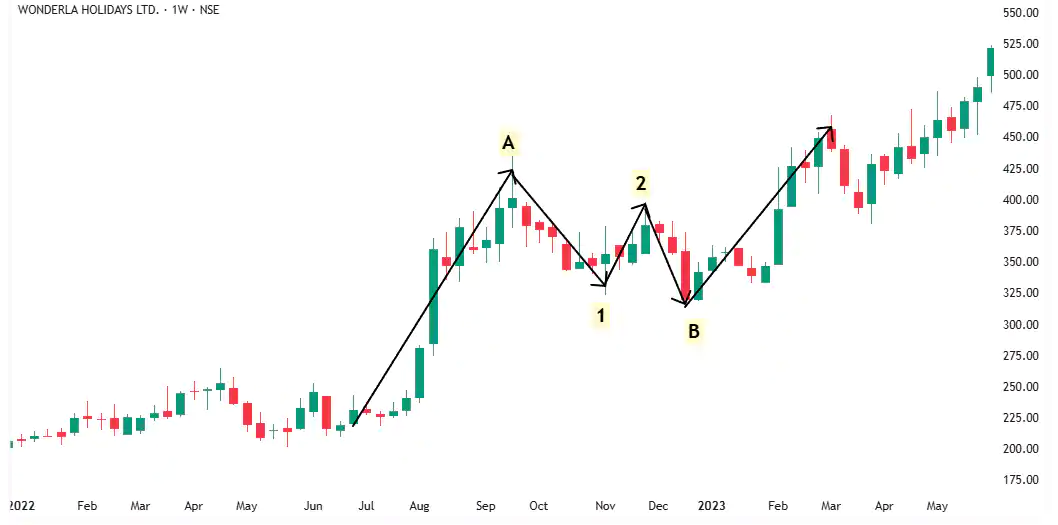
Example 1:
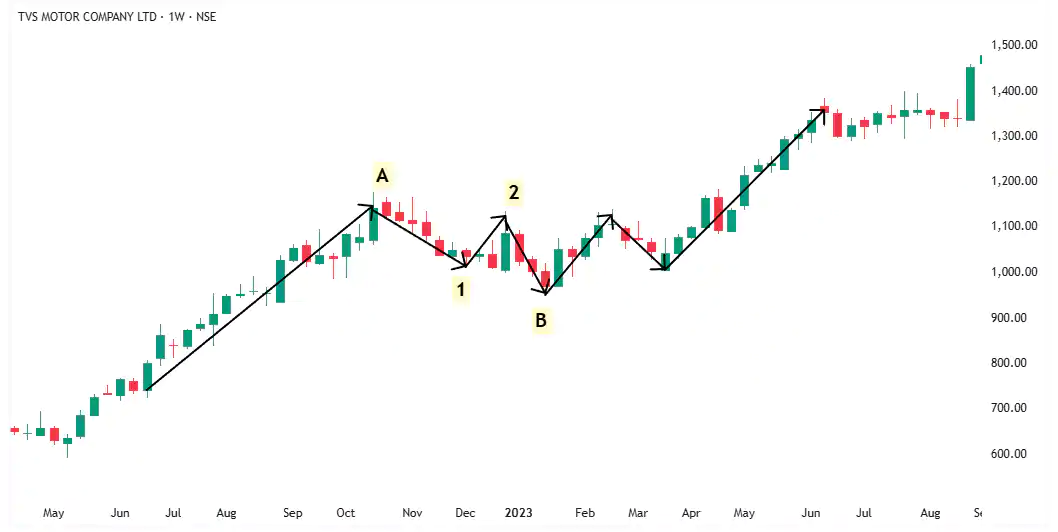
Example 2:
Example 3:
In all these examples, the stock made a Higher Low (HL) at Point 1, a Lower High (LH) at Point 2, and a Lower Low (LL) — but then reversed immediately and resumed the uptrend.
This is the weakness of Dow Theory.
7.2 What’s the Solution?
Don’t rely on Dow Theory alone.
Dow Theory gives you the structure — but not the reason behind the move.
It shows you what’s happening, but not why it’s happening.
You can’t avoid complex corrections by using technical analysis alone. If you do, you’ll fall into the trap every time.
The real solution is to combine Dow Theory with fundamental analysis.
If the business is strong, earnings are growing, and valuations are reasonable, then what looks like a trend reversal is often just a deep correction.
In Step 3: Fundamental Analysis, I’ll show you exactly how to filter out these traps.
Dow Theory gives you the structure.
Fundamentals give you the conviction.
Together, they help you ignore the noise and stay with the winners.
Conclusion
Dow Theory won’t predict the future.
But it will protect you from being on the wrong side of the market.
It helps you enter early, exit smart, and stay disciplined through chaos.
And when combined with fundamentals, Dow Theory becomes one of the most reliable tools you’ll ever use.
Follow the price. Understand the story. That’s how real traders win.