HERO - A Complete Trading Strategy For Retail Traders
Before we begin, I have two small requests.
1. Please don’t skip any section.
Each part is connected and builds on the previous one. If you skip something, you might miss a key idea. The goal is to help you understand the HERO strategy from the ground up.
2. Read with an open mind.
Some concepts may be new or feel unimportant at first. But every idea has a purpose and plays a role in the full strategy. You can use this strategy for swing trading or for long term trading. Give each section your full attention.
These two simple things will help you get the most out of what’s ahead.

Part 1: Why does a stock price go up?
Imagine you want to buy a small business — like a toy shop.
You ask one simple question:
“How much money does this shop make every year?”
If the shop makes ₹1 lakh a year, you’ll pay a certain price. If it makes ₹10 lakh a year, you’ll pay a higher price.
Because a shop that earns more is more valuable.
Now think about this:
A stock is just a tiny piece of a real business. So, when you buy a stock, you’re buying a piece of that business.
And just like with the toy shop — what matters most is: How much money is this business making?
As the company makes more money, it becomes more valuable. As the business becomes more valuable, stock price also goes up because a stock is just a tiny piece of the business.
So, price of a stock depends on the earnings of the company.
If the company makes more money in the future, its stock price will go up. And if the company makes less money in the future, its stock price will go down.
But earnings is not the only variable on which stock price depends.
There is one more variable.
Let’s say a company is expected to grow its earnings by 25% for the next few years.
But suddenly, a negative rumour spreads on social media saying the company is involved in a fraud.
Some investors get scared and decide to sell their stock immediately, fearing that if the rumour is true, the stock will crash.
This panic selling is an emotional decision, not based on the company’s actual earnings.
As a result, the stock price drops, even though the company’s earnings haven’t changed.
Later, when the company clears up the rumour, investors’ fear fades, and they start buying the stock again.
So, while stock prices depend on earnings in the long term, in the short term, stock prices often depend on the emotions of investors.
If investors feel optimistic about the company, the price goes up. If they feel pessimistic or scared, the price falls.
Investor’s mood is the second key variable that affects stock prices.
• In the long term, Stock Price depends on the earnings of the company.
• In the short term, Stock Price depends on the mood of the investors.

Part 2: Golden Equation of stock market
Now you know:
- In the long term, a Stock Price depends on the earnings of the company.
- In the short term, Stock Price depends on the mood of the investors.
Let’s now turn this idea into a simple equation.
Earnings Per Share (EPS):
EPS tells you how much profit a company earns for each share it has issued.
For example, suppose company XYZ has issued 2 crore shares, and its total annual profit is 20 crores.
To find EPS, divide the total earnings by the total number of shares:
EPS = Total Earnings / Total Shares
EPS = 20 crores / 2 crores = 10
So, company XYZ’s EPS is 10, meaning the company earns ₹10 per share.
EPS is a key variable on which a stock’s price depends.
If the company makes more profit in future, its EPS will increase and stock price will also go up.
Price-to-Earnings (P/E) Ratio:
The P/E ratio tells you how much investors are willing to pay for ₹1 of a company’s earnings.
You can calculate it by dividing the stock price by the EPS.
For example, if company XYZ’s stock price is ₹200 and its EPS is 10:
P/E Ratio = Stock Price / EPS
P/E Ratio = 200 / 10 = 20
The P/E ratio is second key variable on which stock’s price depends.
P/E ratio represents the mood of the investors. If the investors are optimistic, P/E ratio will be high. If investors are pessimistic, P/E ratio will be low.
Now that you know a stock’s price depends on earnings in the long term and investor mood in the short term, we can turn that into a simple equation.
Stock Price = (EPS) x (P/E ratio)
This is the Golden Equation of stock market.
If you understand this equation, you can estimate the future price of any stock. And in the next sections, I’ll show you exactly how to do it.
Let’s test the Golden Equation with a real-life example.
- Open the chart of any stock and check its current price.
- Find its EPS and P/E ratio using free online tools (just search on Google).
- Apply the Golden Equation.
For example, let’s take Reliance Industries.
As I’m writing this, the P/E ratio of Reliance is 22.88, and the EPS is 51.14
You can simply Google “EPS of Reliance” or “P/E ratio of Reliance” and you will get this information instantly.
According to the Golden Equation:
Stock Price = EPS × P/E Ratio
Stock Price = 51.14 × 22.88 = 1170.08
Now, let’s check the actual stock price of Reliance.
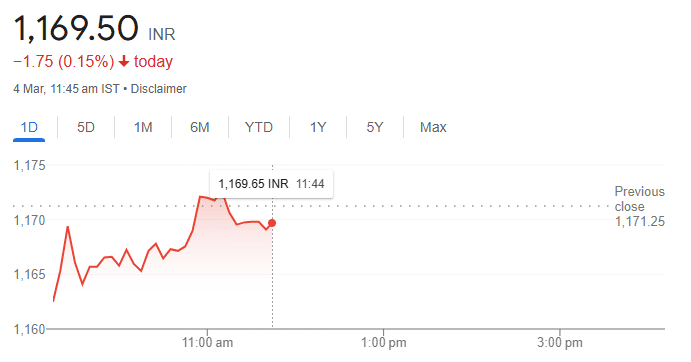
The live price of Reliance is ₹1169.5
The slight difference between our calculated price (₹1170.08) and the live price (₹1169.5) is because stock prices fluctuate in real-time.
If you perform this calculation after-market hours, when prices are stable, you will get an accurate result.
Stock Price = (EPS) x (P/E ratio)
This is the Golden Equation of stock market.
• EPS represents the earnings per share of the company.
• P/E ratio represents the mood of the investors.
Part 3: How to Predict the Future Price of Any Stock?
Most people blindly hope their stock will go up.
But hope is not a strategy.
What if you could actually calculate the future price before you buy?
That’s exactly what the Golden Equation helps you do.
According to golden equation:
Stock Price = (EPS) x (P/E ratio)
Formula for Predicting the Future Stock Price:
Future Stock Price = (Future EPS) × (Future P/E ratio)
The future price of a stock depends on future EPS and future P/E ratio of the company. If you can predict the future EPS and future P/E ratio then you can predict the future price of any stock.
Let’s look at an example:
Let’s say a company’s current EPS is ₹20 and its current P/E ratio is 30.
So, the stock price = (EPS) x (P/E ratio)
= 20 x 30
= ₹600
Now, after doing some research, you expect the EPS to grow by 50% in one year, and the P/E ratio to remain the same.
Calculating Future Price:
Future EPS = 1.5 x Current EPS
= 1.5 x 20
= ₹30
You expect the P/E to remain at 30. So, future P/E ratio = 30
Future Stock Price = (Future EPS) × (Future P/E ratio)
= 30 x 30
= ₹900
So, the price is expected to go from ₹600 to ₹900 — a 50% increase in one year.
Test Yourself
Let’s say a company’s current EPS is ₹30 and its current P/E ratio is 25. After doing some research, you expect the EPS to grow by 40% and P/E ratio to increase by 35% in one year.
Now can you calculate the future price of the stock?
Step 1: Calculate Future EPS and Future P/E Ratio
Future EPS = 1.4 x Current EPS
= 1.4 × 30 = ₹42
Future P/E Ratio = 1.35 x Future P/E ratio
= 1.35 × 25 = 33.75
Step 2: Calculate Future Stock Price
Future Stock Price = (Future EPS) × (Future P/E ratio)
= 42 × 33.75 = ₹1417.5
The Million-Dollar Question:
If you know the future EPS and future P/E ratio of the company then predicting the future stock price becomes easy.
Now the Million-Dollar question is: How do you accurately predict future EPS and future P/E ratio of any company?
This is exactly what I’ll show you in the next sections. Even if you’re a complete beginner, you’ll understand how to estimate the future EPS and future P/E ratio of any company.
Just one small request: Give your full attention to the next section. It’s the backbone of the HERO strategy.
Future Stock Price = (Future EPS) × (Future P/E ratio)
• The future price of a stock depends on future EPS and future P/E ratio of the company.
• If you can predict the future EPS and future P/E ratio then you can predict the future price of any stock.
• In the next sections, I’ll show you how to predict future EPS and future P/E ratio of any company.
Part 4: How to Predict Future Earnings Growth (EPS) of any company
Imagine you own a toy-manufacturing company.
Right now, your factory is built on 5,000 square meters of land and produces 1 lakh (100,000) toys every year. Each toy sells for ₹300, so your total yearly sales are ₹3 crores.
After studying the market, you realize there’s a huge demand for toys, but your factory doesn’t have enough capacity to produce more. So, you decide to expand.
You buy another 10,000 square meters of land and build a second factory, which will produce 2 lakh (200,000) more toys each year.
Once this expansion is complete, your company will have the capacity to produce 3 lakh (300,000) toys annually.
However, the new factory will take a year to build, including land acquisition and government approvals. In the second year, when the factory is fully operational, you will start producing at full capacity.
Now, let’s calculate your future sales:
- After expansion, you’ll make 3 lakh toys a year.
- Each toy sells for ₹300.
- So, total yearly sales will be ₹9 crores.
This means your company’s sales will grow from ₹3 crores to ₹9 crores in just two years.
By looking at a company’s capacity expansion plans (also called Capex), you can predict its future growth.
To predict the future growth of a company, you need to understand the future plan of the company.
The size of the capacity expansion tells you how much the company can grow. The timeline tells you when the growth will happen.
Now, let’s look at a real-life example.

4.1 Predicting Future Growth Using Capacity Expansion Plan
By simply looking at the capacity expansion plan of the company, you can estimate how much it will grow in future.
Capacity expansion is the first sign that a company will grow in future.
Example: Sky Gold
In Mumbai, there’s a company called Sky Gold that specializes in gold jewellery. They’ve been in this business for over 20 years and know the industry inside out.
Originally, they had a manufacturing facility in Mulund, Mumbai, where they could produce up to 300 kg of gold jewellery per month.
But after analyzing the growing demand for gold jewellery, they decided to expand their production capacity.
To achieve this, they moved to a larger facility in Navi Mumbai, which now allows them to produce 750 kg of gold jewellery per month—more than double their previous capacity.
Now, let’s think about what this means for their future growth.
If they were making a profit of X crores by selling 300 kg per month, then with 750 kg per month, their profit could increase by 2.5 times (assuming demand remains strong and they sell everything they produce).
This also means their EPS (Earnings Per Share) should grow by 2.5 times.
In May 2024, Sky Gold’s EPS was 3.06
So, the future EPS can be estimated as:
Future EPS = 2.5 × Current EPS
= 2.5 × 3.06
= 7.65
This is how you can predict the future EPS of a company by analyzing its expansion plans.
Now, you might be wondering—where did I find this important information about capacity expansion plans of the company?
Don’t worry! I’ll show you exactly how you can find such valuable insights about any company.
4.2 Predicting Future Growth Using Order Book
Apart from capacity expansion, another way to predict a company’s future growth is by analyzing its order book.
Example: Zentec
Zentec, a Hyderabad-based company, specializes in anti-drone systems and combat training simulations for military forces worldwide.
- They provide anti-drone equipment that can shoot down enemy drones.
- They also offer combat training simulations, allowing soldiers to train with real weapons in a controlled environment.
In financial year FY 2024, Zentec generated ₹440 crores in revenue by selling these products to different countries’ armies.
By March 31, 2024, the company had an order book worth ₹1,400 crores. This means they already have confirmed orders to manufacture and sell ₹1,400 crores worth of equipment in the future.
Zentec announced that in FY 2025, they plan to execute orders worth ₹900 crores. The remaining ₹500 crores will be completed in the following year.
So, in FY 2025, revenue is expected to jump from ₹440 crores to ₹900 crores—more than double in just one year!
If revenue doubles in a year and profit margin remains the same, earnings (EPS) of the company will also double in a year.
A large order book gives high visibility into a company’s future growth. Since the orders are already in hand, the company only needs to manufacture and deliver the products.
By simply looking at order book size and timeline for order completion, you can estimate how much a company will grow in the coming years.
Size of order book tells you how much a company will grow in future and timeline for order completion tells you when the company will grow.

4.3 How to find the Future Plan of any company
You don’t need insider access to know what a company is planning.
Finding the future plan of the company is much easier than you think.
This insider-level information is publicly available—you just need to know where to look and how to interpret it.
There are two key sources where you can find the future plan of the company.
1. Company’s Conference Calls
Companies report earnings four times a year (every quarter). After announcing results, they hold a conference call with investors.
This call typically lasts about an hour, and investors ask important questions like:
- What is the company’s growth plan?
- Are they expanding capacity or launching new products?
- How fast is the industry growing?
- What is the size of order book?
By simply listening to the conference call, you can understand the future plan of the company and predict its future growth.
Think about it:
If you spend just one hour listening to conference call, you can find a company which is expected to increase it earning in future. If the earning increases, stock price will also increase.
2. Company’s Investor Presentation
After reporting earnings, companies release an “Investor Presentation.”
This document explains:
- The company’s future growth plans
- Expectations for industry growth
- Any upcoming expansions or projects
- Size of order book
By reading the Investor presentation, you can get a clear roadmap of how the company plans to grow.
4.4 How to Find Conference Call and Investor Presentations
Finding a company’s conference call and investor presentation is easy!
Just Google:
“[Company Name] conference call”
“[Company Name] investor presentation”
For example, if you want Reliance Industries’ conference call, search “Reliance Industries conference call” on Google. You will find the latest details right away.
Similarly, you can find the investor presentation of any company.
• To predict the future earnings growth (EPS) of the company, you need to understand the future plan of the company.
• By listening to the conference call and reading the Investor presentation, you can easily understand the future plan of any company.
• Capacity expansion (Capex) is the first sign that a company will grow in future.
• The size of the capacity expansion tells you how much the company can grow. The timeline tells you when the growth will happen.
• Size of order book tells you how much a company will grow in future and timeline for order completion tells you when the company will grow.
Part 5: How to Predict Future P/E Ratio of Any Company
Let’s revisit the Golden Equation of the stock market:
Stock Price = EPS × P/E Ratio
You’ve already learned how to estimate a company’s future EPS. Now it’s time to learn how to estimate its future P/E ratio.
Once you know both—future EPS and future P/E—you can predict the future stock price easily.
Before we get into future P/E ratios, let’s understand something called the PEG ratio. It helps you figure out whether a stock is cheap or expensive.
5.1 PEG Ratio
The PEG ratio tells you if a stock is cheap or expensive.
It’s easy to calculate. Just follow these steps:
- Find the current P/E ratio of the stock.
- Estimate how much the company’s EPS will grow over the next 2–3 years.
Now, use this formula:
PEG Ratio = P/E Ratio ÷ Future EPS Growth Rate
Example:
- Let’s say the company’s profit is expected to grow at 40% per year for next couple of years.
- Its current P/E ratio is 20.
So,
PEG = 20 ÷ 40 = 0.5
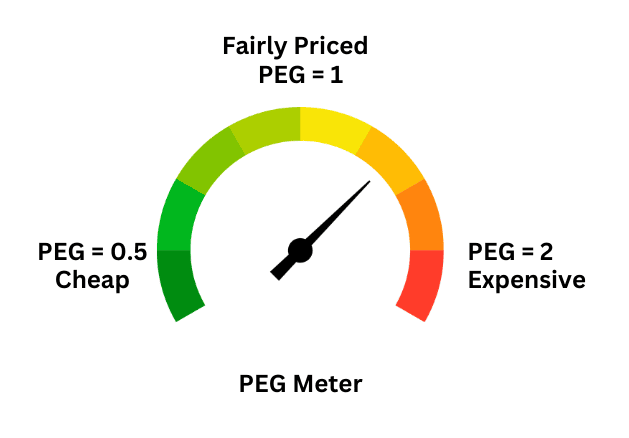
How to read it:
- PEG = 1 → Fairly priced
- PEG < 1 (e.g. 0.5) → Stock is cheap
- PEG > 1 (e.g. 2) → Stock is expensive
In this case, the PEG is 0.5 — which means the stock is cheap.
5.2 Predicting Future P/E Ratio
The P/E ratio reflects investor mood.
When people feel positive about the market, the P/E is high. When they feel negative, the P/E is low.
Investor mood changes with time. If the economy is doing well, P/E goes up. If things look bad, P/E goes down.
So, predicting future P/E is about guessing future investor sentiment.
That may sound hard—but there’s a pattern.
Investor sentiment, like the market, moves like a pendulum. It swings between fear and greed. And the P/E ratio swings along with it.
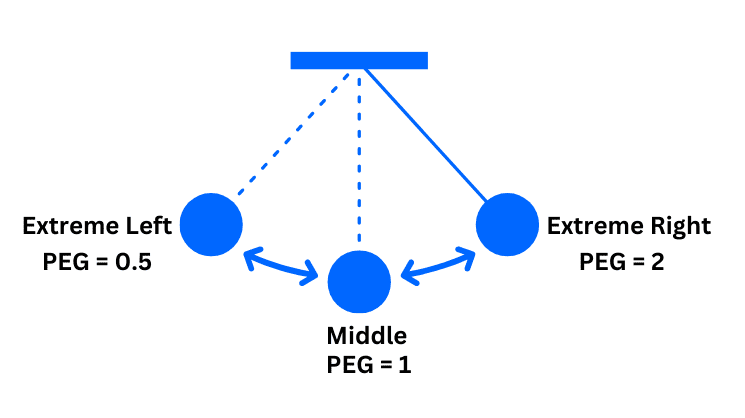
When sentiment is negative, the pendulum swings left. P/E is low.
As mood improves, the pendulum moves to the centre.
Eventually, it swings to the right—where optimism pushes P/E too high.
It rarely stays in the middle.
If you buy when the pendulum is on the left—when the PEG is 0.5 or lower—there’s a good chance that it will swing to the right in future.
Stocks with a PEG of 0.5 often double their P/E ratio in 12 to 18 months.
This pattern repeats itself across market cycles:
- Wait for a situation when overall market is falling and sentiment is negative.
- Find a stock with a PEG ratio of 0.5 or less that is resisting the broader market decline.
- When the market sentiment turns positive, this stock’s P/E ratio will at least double in value.
I have seen this pattern repeat again and again—making it one of the most reliable ways to predict the future P/E ratio.
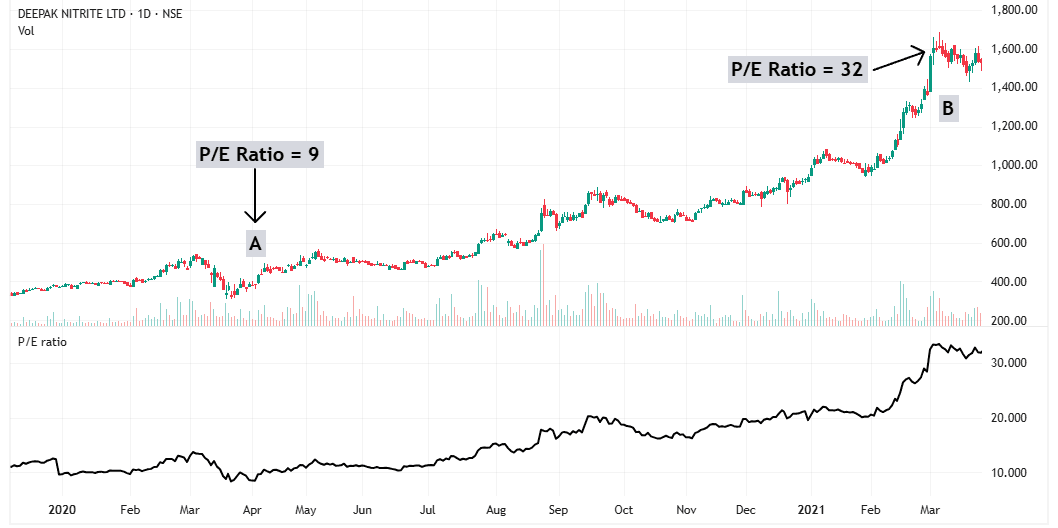
Example: Deepak Nitrite
When the market crashed in March 2020, Deepak Nitrite resisted the decline. At that time, its P/E ratio was around 9, and the company was expected to grow its earnings by 20-25% per year.
Using the PEG ratio formula:
PEG = P/E ÷ Expected Growth Rate
= 9 ÷ 20
= 0.45
This meant the stock was cheap.
As market sentiment improved, Deepak Nitrite’s P/E ratio expanded from 9 to over 30—more than tripling in value.
When the P/E ratio starts rising, there is no fixed limit on how high it can go. However, a good rule of thumb is that it will at least reach a fair value (PEG = 1).
If you buy a stock when PEG = 0.5, you can confidently expect it to reach 1 over time. In many cases, it can go even higher—reaching 1.5 or 2—but the doubling of PEG ratio is a conservative estimate.
This is why finding stocks with a low PEG ratio during market downturns can lead to huge gains when sentiment improves.
• PEG ratio tells you whether a stock is cheap or expensive.
- PEG = 1 → Fairly priced
- PEG < 1 (e.g. 0.5) → Stock is cheap
- PEG > 1 (e.g. 2) → Stock is expensive
• Buy a stock with PEG ratio of 0.5 during weak market sentiment, and P/E can double in next 12–18 months.
Part 6: Marry Fundamentals with Technicals
If you just want to invest, then finding companies with strong future growth and buying them at fair or cheap prices is enough.
But if you want to build a trading strategy, you can’t rely only on fundamentals. You also need to know when to buy and sell. That’s where technical analysis comes in.
Fundamental analysis helps you find growing companies. It also tells you if a stock is cheap or expensive. That’s perfect for long-term investors.
But traders need more. They need timing. And for that, you need technical analysis.
So now, we marry the two—fundamentals and technicals.
Here’s the game plan: Use fundamentals to find good companies at reasonable prices. Then use technicals to find the right time to enter and exit.
That’s it.
Simple.
No complications.
I call this the HERO strategy. I’ll explain it step-by-step in the next sections.
If you’re feeling overwhelmed, take a short break. Don’t worry—I’ve created in-depth chapters to guide you step by step.
You’ll learn:
– How to find growing companies
– How to check if they’re cheap or expensive
– And how to time your trades with technical analysis
Let’s take it slow and steady.
Now let’s go to technical analysis but before we jump to that, I want to show you one powerful idea first.
It’s called relative strength.
6.1 Relative Strength
Relative Strength is the process of comparing two stocks to find which one is stronger and which one is weaker.
Relative Strength is one of the most powerful tools in technical analysis. It increases the probability of finding a successful chart pattern.
If the market is falling but a stock is holding steady or going up, that stock is showing strong relative strength.
Most stocks fall when the market falls. But if a stock doesn’t, there’s usually one reason — big investors are buying it.
Institutions don’t buy blindly. They do deep research. If they believe a company will grow profits, they start buying early — even when the market is weak.
And when the market stops falling, these strong stocks move up first — and fast.
Take BLS International as an example.
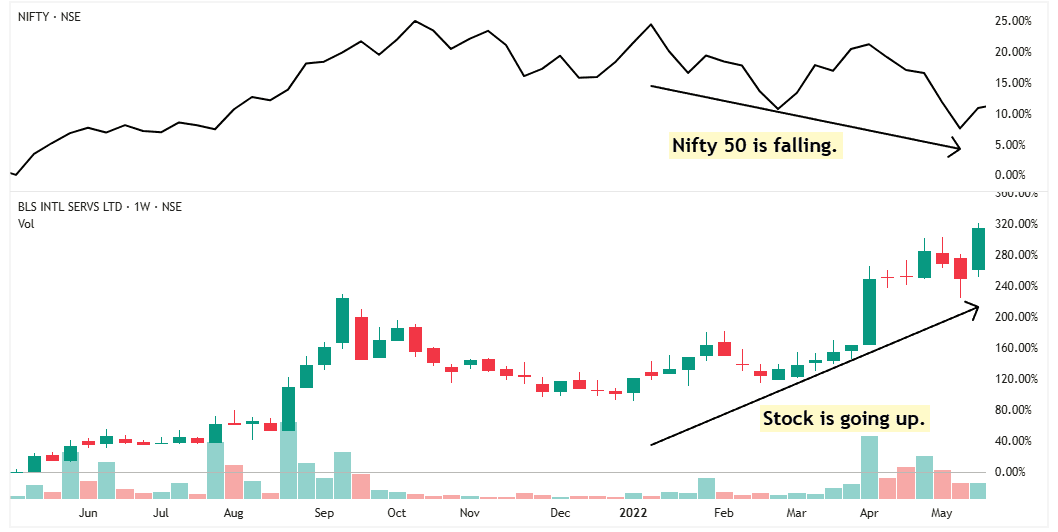
In the upper half of the chart, black line represents the market (Nifty 50).
While the Nifty 50 was falling, this stock was rising.
The reason is simple: Big institutional investors were buying the stock because they expected strong earnings in the future.
That’s why the stock stayed strong—even when the market was falling. This is what we call strong relative strength.
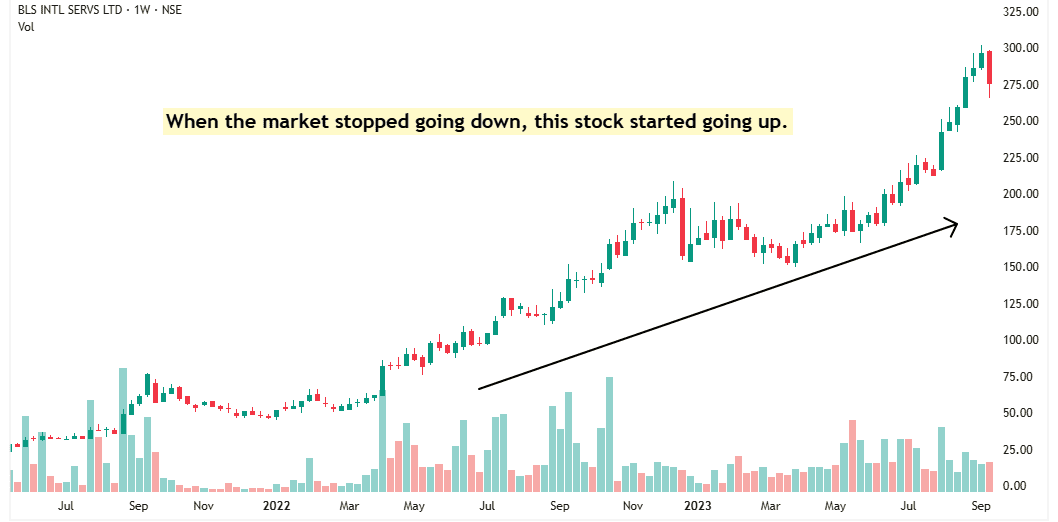
Now look at what happened in the chart— The moment the market stopped falling, the stock shot up.
It may seem like the stock went up because of strong relative strength.
But here’s the truth—The stock showed relative strength because smart money was already buying, expecting earnings to grow.
And when the earnings came, the stock followed. Stock prices follow earnings. Wherever earnings go, prices follow.
Look at the earnings chart of BLS International.
As the company reported strong earnings growth, the stock price also moved up.
When institutional investors were buying earlier, they were expecting this kind of growth.
And when those earnings actually came, the stock price followed — just as they had anticipated.
Before you open a chart and look for a buying point, make sure the stock is relatively stronger than the market.
A strong stock means big institutional investors are already buying it. Once the market stops falling, there’s a good chance this stock will break out and start moving up.
6.2 Zero Supply
When I say “zero supply,” I don’t mean the supply is literally zero. I mean a situation where demand is very high, but the supply in the market is almost gone.
If you buy a stock when demand is strong but supply is nearly zero, the stock has no choice but to go up.
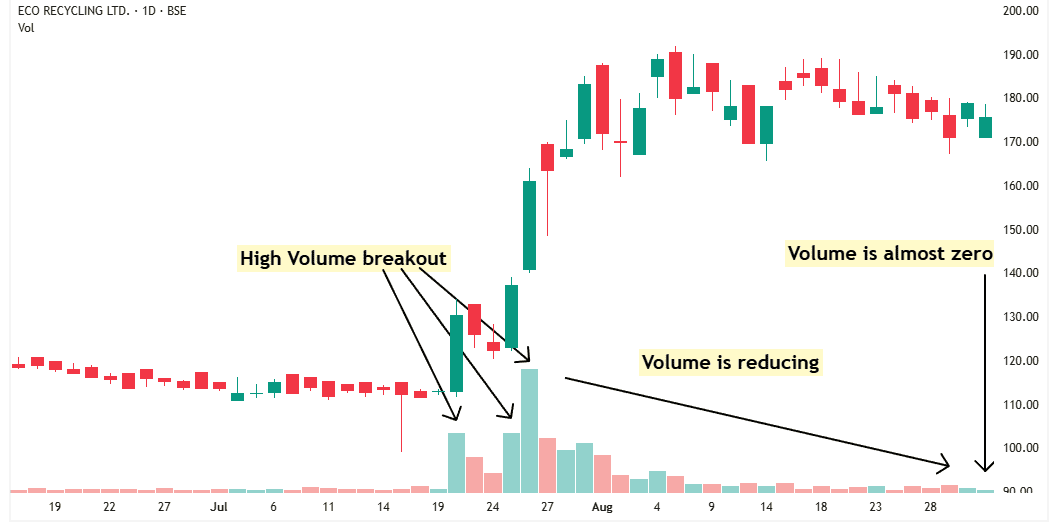
Take the example of Ecoreco.
There’s a sudden surge in volume, and the stock breaks out with huge volume and starts rising.
This kind of volume can’t come from retail investors — it clearly shows that institutional investors are buying.
Institutions don’t buy a few hundred shares. They buy in large quantities, and their buying pressure pushes the price higher.
When short-term traders get these sudden gains, they start booking profits — this creates some supply. Meanwhile, institutions avoid pushing the price too high, so they keep buying slowly.
The stock then starts moving sideways. During this time, short-term traders are selling to book profits, and institutions are absorbing that supply.
Slowly, volume dries up. This drop in volume is a sign that most of the supply has been absorbed.
Now, demand is still strong, but supply is almost zero. The stock has no option — it goes up.
If you wait for the moment when demand is strong and supply is almost gone, your chances of success go up. That’s the right time to buy the stock.
• Our game plan is simple: Use fundamentals to find good companies at reasonable prices. Then use technicals to find the right time to enter and exit.
• Relative Strength is one of the most powerful tools in technical analysis. It increases the probability of finding a successful chart pattern
• If you buy a stock when demand is strong but supply is nearly zero, the stock has no choice but to go up.
Part 7: HERO Strategy (A Techno - Fundamentalist Strategy)
Before I explain the HERO strategy, let’s quickly go over what you’ve learned so far.
You now know how to:
1. Predict future earnings (EPS) of a company
2. Judge if a stock is cheap or expensive
3. Use Relative Strength to find strong stocks
4. Read charts to spot high demand low supply zones
That’s all you need.
The first two steps are about fundamental analysis—finding companies that will grow and are reasonably priced.
The next steps use technical analysis to help you buy at the right time.

7.1 Introduction to HERO strategy
Each letter in HERO stands for one step. When applied together, they form a complete, money-making strategy.
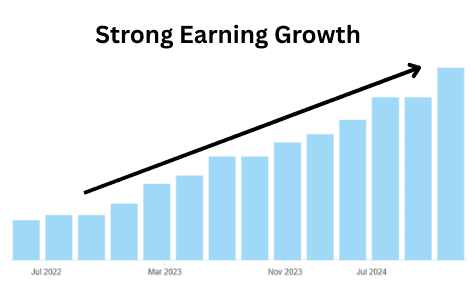
H stands for High Earnings Growth
The first step is to find a company with strong earnings growth. If earnings grow rapidly, the stock price will follow.
You already know how to estimate future earnings by understanding the company’s plans.
Just listen to the conference calls and read the investor presentations. They’ll tell you everything you need to know.
E stands for Expensive or Cheap
Next, check if the stock is reasonably priced. Even a high growth company isn’t worth buying if the valuation is too high.
We want companies that are either cheap or fairly valued.
Use the PEG ratio to judge whether the stock is expensive or not.
R stands for Relative Strength
Once you’ve found a high-growth company at a reasonable price, make sure it’s performing better than the market.
A stock with high relative strength tends to give good returns. Use relative strength to confirm the stock is a leader, not a laggard.
O stands for Zero Supply
‘O’ stands for zero—not orange.
This step is all about finding a spot where demand is high and supply is nearly zero.
When supply dries up and buyers are still interested, the price has no choice but to go up. That’s when you buy.
By following these four steps, you’ll find stocks that are fundamentally solid and technically strong.
Before we dive into a real-life example, let’s first understand the pros and cons of this strategy.
7.2 Advantages of HERO strategy
1. Freedom from the screen
You don’t need to watch the market all day.
No more staring at charts or stressing over price moves.
You can live your life—spend time with family, travel, or focus on your work—without worrying about the market.
2. Fits your schedule
Whether you have a full-time job or run a business, this strategy works for you.
You don’t need to compromise with your job or business. You don’t need to study the market every day.
This strategy is perfect if you don’t have the time to track the market every day but still want to make serious money from stocks.
7.3 Disadvantages of HERO strategy
The only disadvantage? You need patience.
This strategy is not for impulsive traders. If you can’t wait, you’ll miss the real rewards. But if you stay calm and wait for the right setup, this strategy can change your life.
You will not take 100 trades a year. Instead, you will wait for high-probability setups—trades that have the potential for massive returns.
This is a sniper strategy.
You don’t fire randomly. You wait for the perfect shot—sometimes for weeks or even months—and when the time is right, you strike with precision.
Overview of HERO strategy
1. H stands for High earnings growth.
First step is to find a company that will grow its earnings rapidly.
2. E stands for expensive or cheap
Second step is to check whether stock is cheap or expensive. Use PEG ratio to evaluate it.
3. R stands for Relative strength
Third step is to make sure stock is relatively stronger than the market.
4. O stands for Zero supply
Fourth step is to buy when demand is high and supply is almost zero.
• If you have a job or a business, this strategy fits perfectly in your schedule.
Part 8: Real-Life Example (KPI Green)
Now, its time to see how to apply the HERO startegy step by step in real life.
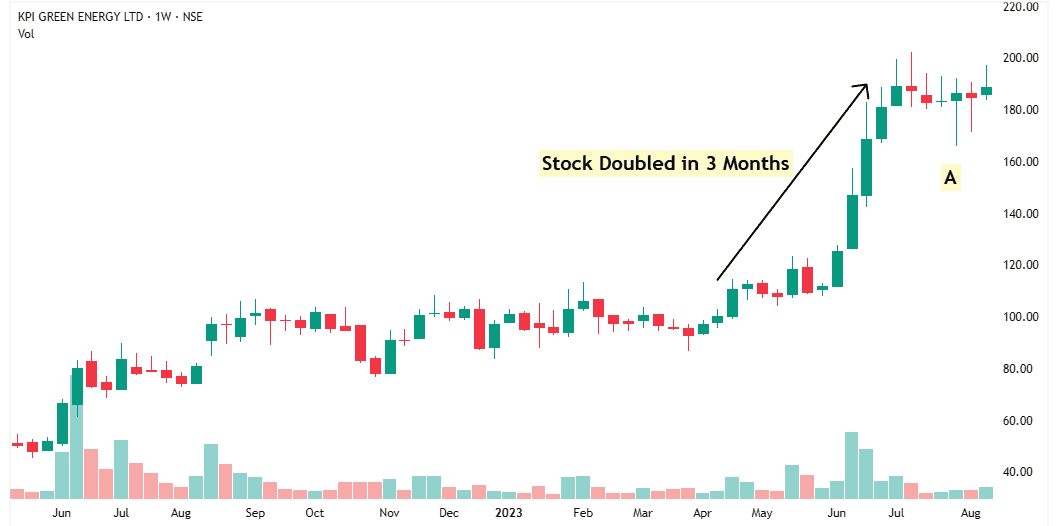
When I was flipping through charts. I noticed a strong, straight-line move. Stock doubled in just 3 months.
Unfortunately, I was not tracking the company at that time. The stock came to my attention at Point A.
A stock doesn’t go up like this without a strong reason. So, I decided to look deeper and understand why this move happened—and whether the company could keep growing in the future.
I found that the company was in the renewable energy sector, and it makes solar panels.
In the investor presentation, the company mentioned that the Government of India was strongly promoting renewable energy. So, the entire sector was expected to grow.
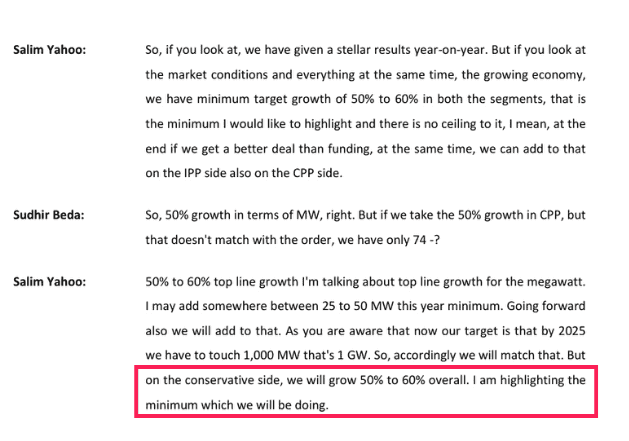
Then I read the company’s conference call transcript. The management said they were expecting at least 50% to 60% growth.
They explained that they already had a solid order book, and more orders were expected to come. That gave them the confidence to guide for this strong growth.
So, this is clearly a high-growth company.
 That means the ‘H’ part of the HERO strategy is done.
At that time, the company’s P/E ratio was 27.1.
Using a conservative growth estimate of 50%, the PEG ratio = 27.1 ÷ 50 = 0.54.
A PEG ratio below 1 means the stock is cheap.
So the ‘E’ part of HERO strategy is also done.
Now I had found a stock that was expected to grow 50% and was still trading at a cheap valuation.
Now, it’s time to check whether the stock is relatively stronger than the market or not.
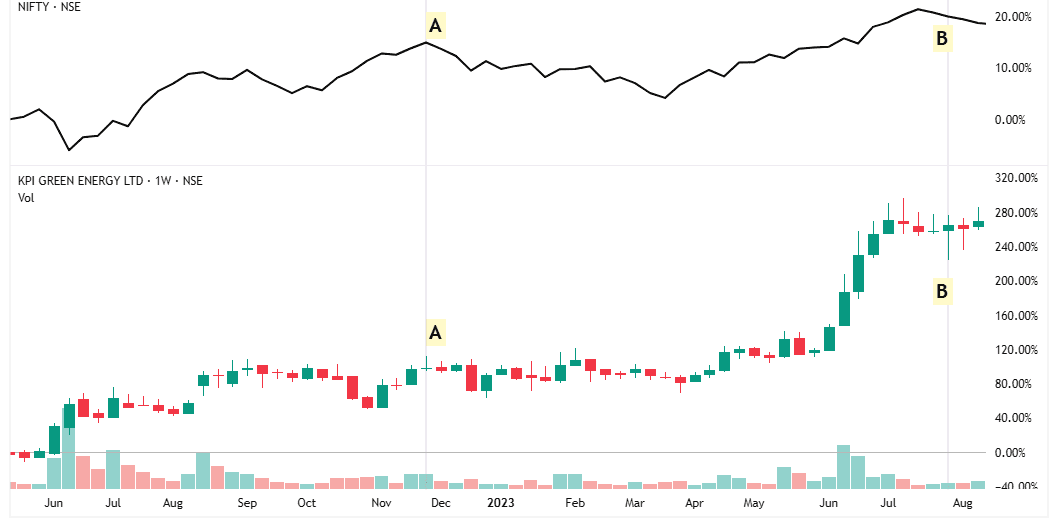
In upper half of the chart, black line represents Nifty 50.
Look at Point A to Point B.
During this time, Nifty barely moved, but this stock went up a lot.
When the market is flat and a stock goes up, it means the stock is relatively stronger than the market.
So the ‘R’ part of HERO strategy is done too.
But at that time, there was no good chart pattern to buy. So, I decided to wait patiently.
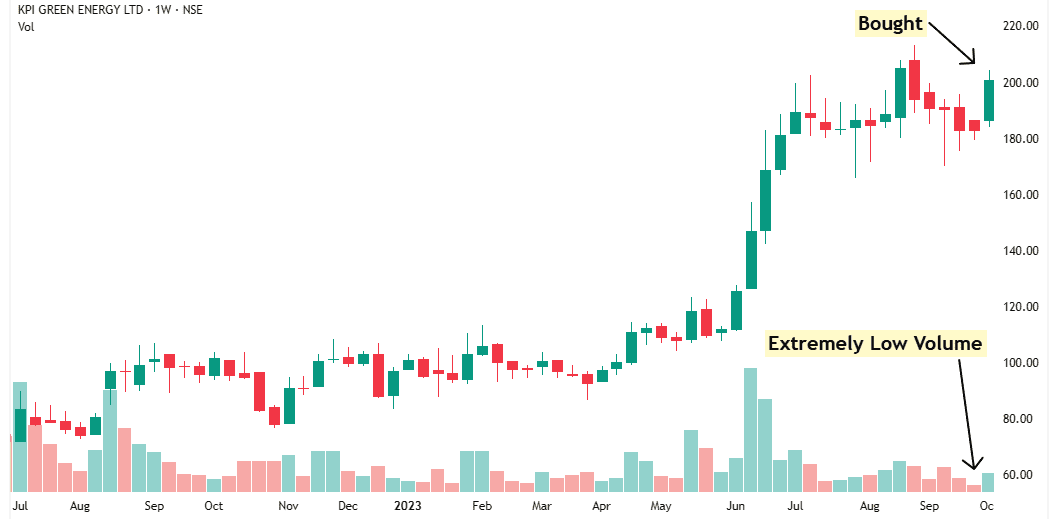
A few weeks later, I noticed something interesting—extremely low volume.
This often means that institutions have absorbed most of the supply, and now, even small demand can push the stock up.
The next week, when the stock moved up on slightly higher volume, I bought half of my intended shares.
The ‘O’ part of the HERO strategy is also complete.
I didn’t buy everything at once because I usually use the scaling-in technique. You’ll learn more about this later.
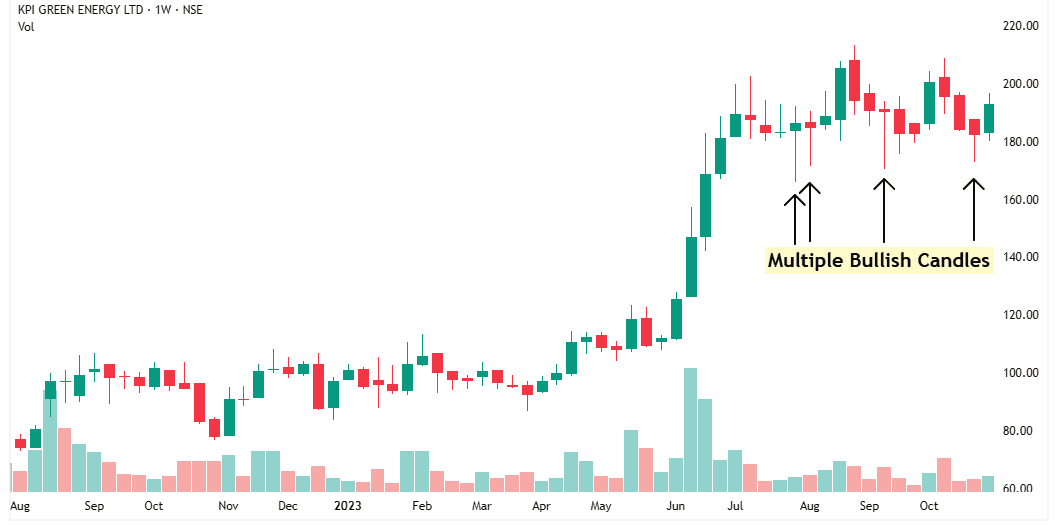
After my first buy, the stock dipped a little, but then it formed another bullish candle, showing buying interest.
I also noticed multiple bullish candles at the support level—clear signs of accumulation by institutions.
This told me that this support zone is strong, and the stock is likely to bounce from here.
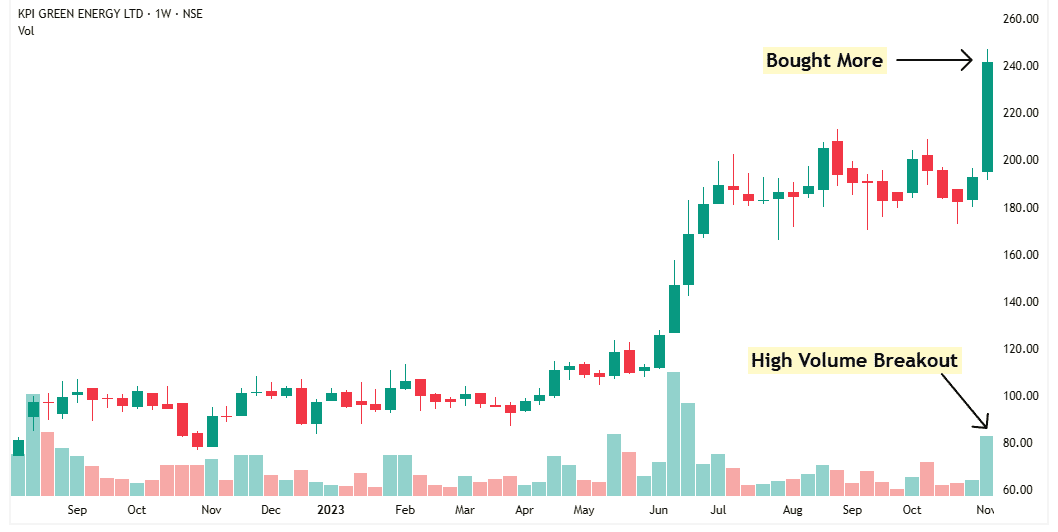
Soon after, the stock broke out on high volume, and I bought the rest of my shares.
Now I had my full position.
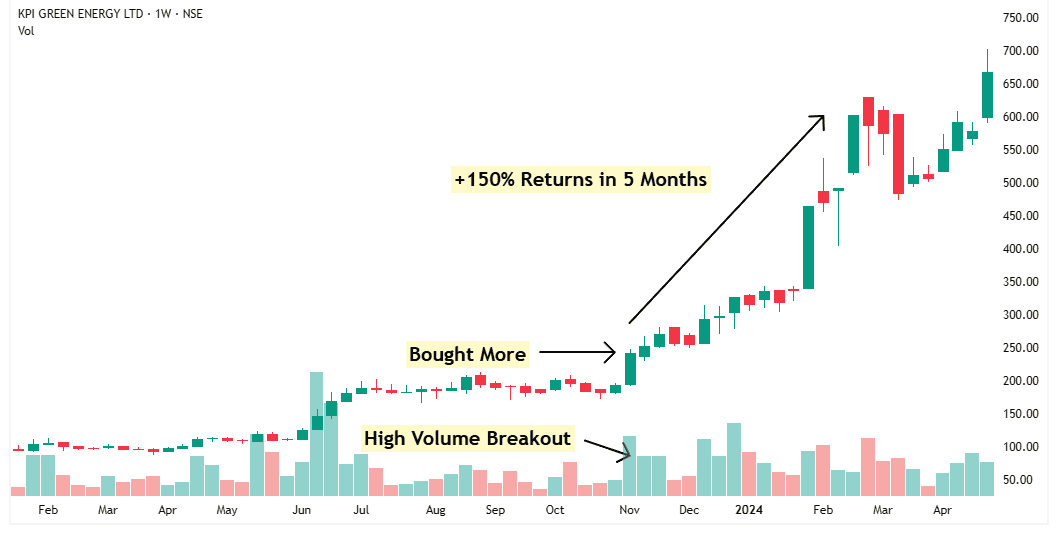
After the company announced its results—and they were just as strong as the management had predicted—the stock went up more than 150% in the next 5 months.
In the upcoming articles, I’ll show you how to sell and book your profit at the right time—so you don’t give it all back.
Part 9: In-Depth Articles For You
You now have a clear overview of the HERO strategy.
You know what it is, why it works, and the core principle behind it.
But there’s more I want to teach you.
I didn’t cover everything here—otherwise, this article would’ve become too long.
Important topics like:
– When to sell
– How to find the perfect HERO trades out of 5,000 listed companies
– How to make more money without increasing your win rate
I’ve written in-depth articles covering each of these.
Click the link below to start reading them.
If you’re a beginner, or if any part of the HERO strategy feels confusing, don’t worry.
I’ve created a simple step-by-step learning path for you.
Just follow the 5 Steps I’ve written — they’ll guide you from the basics to advanced concepts, one step at a time.
Step 1: Avoid These Costly Mistakes
Step 2: Mental Analysis
Step 3: Technical Analysis
Step 4: Fundamental Analysis
Step 5: Macro Analysis
Once you finish the 5 Steps, everything changes. You’ll stop guessing. You’ll start winning.
No more tips. No more noise. Just a clear, proven system.
You’ll know what to avoid, what to buy, and when to act.
You’ll find winners before the crowd.
You’ll trade with confidence.
And most importantly — you’ll be ready to make real money.
Part 10: Join The Newsletter
Every week, I send out the HERO Newsletter.
Join it and see how it can help you become a profitable trader.
You’ll get practical, actionable insights delivered straight to your inbox.
No spam. No noise. Just pure value.
Part 11: Ask a Question
If you have any doubt about the HERO strategy, just ask.
Don’t stay stuck or confused — I’m here to help you.
No question is too small. If it matters to you, it matters to me.
Ask your question below, and I’ll make sure you get a clear answer.