Profit And Loss Statement

By Sachin Malik
Most people don’t know how to read a Profit & Loss statement.
So they rely on others to decide if a company is good or bad.
The problem?
You’re always guessing.
When things go wrong, you don’t know why. You can’t take decisions with confidence.
In this article, I’ll show you how to read a P&L — in a simple way.
You’ll understand any company on your own. No more relying on anyone else.
Table of Contents
Toggle1. What is a Profit and Loss Statement (PNL)?
It shows how much money a company made, how much it spent, and what’s left as profit—for a specific time period.
Imagine you run a restaurant.
In one month, you make ₹4 lakh by selling food.
Your total expenses: ₹2 lakh.
You’re left with ₹2 lakh profit.
That’s it. This is what a Profit and Loss (PNL) statement tells you.

2. Three Types Of Margins
Let’s go one level deeper now.
2. 1 Gross Profit Margin
Take your restaurant business as an example.
You made ₹4 lakh in a month by selling food and drinks.
To prepare that food, you need raw materials—milk, sugar, coffee powder, wheat, rice, vegetables, spices, etc.
Let’s say raw materials cost you ₹1 lakh.
Gross profit = Total revenue – Raw material cost
= ₹4 lakh – ₹1 lakh = ₹3 lakh
This is your gross profit. Just deduct raw material cost from revenue.
Now let’s calculate gross profit margin:
Gross profit margin = (Gross profit ÷ Total revenue) × 100
= (3 ÷ 4) × 100 = 75%
It tells you how much is left after covering raw material cost. If this margin drops, it means your raw material cost is rising.

2.2 Operating Profit Margin
Next comes operating profit margin.
To run the restaurant, you also have rent, staff salaries, electricity, and promotions like pamphlets.
These are your operating expenses — also called SG&A (Selling, General & Administrative).
Let’s say these expenses total ₹1 lakh.
Operating profit = Gross profit – Operating expenses
= ₹3 lakh – ₹1 lakh = ₹2 lakh
Now the operating profit margin = (Operating profit ÷ Total revenue) × 100
= (2 ÷ 4) × 100 = 50%
This margin shows how efficiently you’re running the business.
Lower your expenses, higher your operating profit margin.

2.3 Net Profit Margin
Now comes the final margin — net profit margin.
You made ₹2 lakh as operating profit.
But you still have to pay taxes. Let’s say 25%. Tax = ₹50,000
Net profit = Operating profit – Tax
= ₹2 lakh – ₹50,000 = ₹1.5 lakh
This is also called profit after tax — the money you actually take home.
Net profit margin = (Net profit ÷ Total revenue) × 100
= (1.5 ÷ 4) × 100 = 37.5%
This tells you how strong your overall business is.
If two companies are in the same industry, and one has a net profit margin of 10% while the other has 15% — the second one is clearly doing better.

Margins don’t lie. If they shrink, something’s wrong.
3. Depreciation And Amortization
Before we move ahead, let’s quickly understand two important terms: depreciation and amortization.
Let’s say you expand your restaurant and rent a bigger space. You also buy new tables and chairs worth ₹50,000.
Now the question is: how do you show this ₹50,000 expense in your Profit and Loss statement?
At first, you might think it should go under operating expenses.
But that wouldn’t be fair.
Why?
Because you’re going to use this furniture for the next 5 years—not just this year.
So instead of showing the full ₹50,000 as a one-time expense, you split it across 5 years.
That means you’ll show ₹10,000 as expense each year.
This yearly reduction in value is called depreciation.
So, depreciation is how you show the cost of tangible assets (like furniture) over their useful life.
Now let’s say you also buy a software license for ₹50,000. The license is valid for 5 years.
You’ll use it just like the furniture—over time. So again, you’ll split the cost. ₹10,000 per year.
But here’s the difference: software is a non-tangible asset.
So this ₹10,000 yearly expense is shown as amortization, not depreciation.
In short:
- Use depreciation for physical things like furniture and machines.
- Use amortization for non-physical things like software and licenses.
Now, let’s see how this fits into your Profit and Loss statement…
4. Reading a Profit and Loss Statement
Now let’s put it all together and look at a full Profit and Loss statement.

We’ll stick with the restaurant example—but this time, let’s scale it up and add a few more details.
Let’s say your restaurant makes ₹10 lakh a month in revenue.
Your raw material cost is ₹2.5 lakh.
So, gross profit = 10 – 2.5 = ₹7.5 lakh
You pay ₹1 lakh as salary to your 3 employees. Your rent, electricity, promotions, and software expenses add up to another ₹1 lakh.
Operating profit (before depreciation and amortization) = 7.5 – 2 = ₹5.5 lakh
Now let’s factor in depreciation and amortization.
You bought furniture worth ₹1.25 lakh, and its useful life is 5 years.
So, yearly depreciation = ₹25,000
You also bought a software license worth ₹1.25 lakh, again for 5 years.
So, yearly amortization = ₹25,000
Now subtract both from your operating profit:
Operating profit (after depreciation and amortization) = 5.5 – 0.25 – 0.25 = ₹5 lakh
When you calculate operating expenses, you add:
- SG&A (salary, rent, electricity, promotions, auditor fees, etc.)
- Depreciation
- Amortization
So: Operating expenses = SG&A + depreciation + amortization
Operating profit = Gross profit – operating expenses
Or simply:
Operating profit = Revenue – raw material – operating expenses
Now you have ₹5 lakh as operating profit.
Let’s say you had taken a loan from a bank to start the business.
You pay ₹50,000 per month as interest to the bank.
That’s your finance cost.
Subtract that:
Profit before tax = 5 – 0.5 = ₹4.5 lakh
You pay 33% tax on that. So tax = ₹1.5 lakh
Net profit = 4.5 – 1.5 = ₹3 lakh
That ₹3 lakh is your actual profit—the final number that really matters.
5. Basic Terminologies
In the stock market, people often use different words for the same thing.
It confused me a lot when I started out. So let’s clear them one by one—simple and straight.
5.1 Sales / Revenue / Top Line
All three mean the same.
Sales and revenue are used everywhere.
Top line is just a fancier word, often used in the news.
It’s called top line because it appears at the top of the Profit and Loss statement.
5.2 COGS (Cost of Goods Sold)
This is the cost of raw materials—like rice, vegetables, spices in a restaurant.
It’s the amount you spend on purchasing raw material to make your products.
5.3 SG&A (Selling, General and Administrative Expenses)
These are your everyday operating costs—salaries, rent, electricity, software, promotions, etc.
5.4 EBITDA
Stands for Earnings Before Interest, Taxes, Depreciation and Amortization.
It shows how much profit the business makes from its core operations—before paying interest, taxes, or depreciation.
EBITDA = Revenue – COGS – SG&A Or
EBITDA = Gross Profit – SG&A
(Remember: Gross Profit = Revenue – COGS)
5.5 EBIT
Stands for Earnings Before Interest and Taxes.
Also called operating profit.
It tells you how much the company earns from operations after deducting depreciation and amortization.
EBIT = EBITDA – Depreciation – Amortization
5.6 PBT (Profit Before Tax)
This is the profit left after paying interest, but before paying taxes.
PBT = EBIT – Interest
5.7 PAT (Profit After Tax)
Also called net profit or the bottom line.
This is the final profit left after all expenses, interest, and taxes are paid.
5.8 EPS (Earnings Per Share)
Let’s say a company makes ₹20 crore in profit and has 5 crore shares.
Then:
EPS = PAT ÷ Total Shares = ₹4 per share
EPS shows how much profit the company makes per share.
It’s one of the most important metrics for investors and analysts. I’ll explain it in more detail later.
EPS is not just a number. It’s the story of the business.
5.8 Dividend Payout Ratio
This tells you how much of the company’s profit is shared with shareholders.
If a company earns ₹20 crore and pays ₹5 crore as dividends:
Dividend Payout = (5 ÷ 20) × 100 = 25%
If a company regularly pays dividends, it’s usually a good sign—stable business, consistent profits.
6. An Important Difference
Before we jump into reading an actual Profit and Loss statement, there’s one thing I want to clear up.
If you Google operating profit, most definitions will say:
Operating Profit = EBIT = EBITDA – Depreciation – Amortization
So the formula becomes:
Operating Profit Margin = EBIT ÷ Revenue × 100
But here’s where it gets tricky.
If you check popular investing websites, you’ll see they use EBITDA as the operating profit — not EBIT.
They calculate the margin like this: Operating Profit Margin = EBITDA ÷ Revenue × 100
Not just websites — most research analysts and even company management teams follow the same approach.
And that creates confusion.
It confused me for a long time too.
So here’s the key: When you hear analysts or management talk about “Operating Profit” or “Operating Margin,” they’re usually referring to EBITDA, not EBIT.
Yes, technically EBIT is the correct definition of operating profit. But in real-world investing, EBITDA is what people actually use.
Why?
Because depreciation and amortization are easy to manipulate.
Let me explain.
Say you buy a chair for ₹100.
If you say it will last 5 years, depreciation becomes ₹20 per year.
But if you say it’ll last 10 years, depreciation drops to ₹10 per year.
See?
You can change the depreciation on paper without actually changing anything in the business.
Same goes for amortization.
That’s why most analysts stick to EBITDA — it’s harder to manipulate and reflects the core business more clearly.
So from this point onward, whenever I say operating profit, I mean EBITDA.
Just remember that and you won’t get confused later.
Now let’s look at a real P&L statement — and I’ll show you how to pull out real, useful insights from it.
Most analysts say operating profit but mean EBITDA.
7. Real Life Example
Now it’s time to read a real Profit and Loss statement.

Source: Screener.in
This is the half-yearly P&L of Enser Communications. All figures are in crores.
Let’s go line by line.
1. Sales (Top Line)
Look at the Sep 2024 column. The company reported sales of ₹39.02 crore.
Since it’s the first line in the statement, it’s often called the top line.
2. Operating Expenses
Total expenses: ₹31.92 crore.
This includes all costs needed to run the business—mostly employee salaries, rent, and other operational expenses.
Enser is a software company, so there’s no raw material cost. That means COGS = 0.
3. Operating Profit (EBITDA)
Operating Profit = Revenue – Operating Expenses
= 39.02 – 31.92 = ₹7.10 crore
4. Operating Profit Margin (EBITDA Margin)
OPM = (Operating Profit ÷ Revenue) × 100
= (7.10 ÷ 39.02) × 100 = 18.20%
5. Other Income
Sometimes companies earn money from non-core activities.
For example, if your restaurant sells coffee mugs on the side, that income is shown under other income.
In Enser’s case, other income = ₹0.38 crore.
6. Interest
Enser has a loan and pays ₹0.40 crore as interest. This is the finance cost.
7. Depreciation & Amortization
₹0.39 crore is the combined depreciation and amortization.
Let’s now calculate EBIT (Earnings Before Interest and Taxes):
EBIT = EBITDA – Depreciation & Amortization
= 7.10 – 0.39 = ₹6.71 crore
8. Profit Before Tax (PBT)
PBT = EBITDA + Other Income – Interest – Depreciation
= 7.10 + 0.38 – 0.40 – 0.39 = ₹6.69 crore
9. Tax
Tax paid = 27.5% of ₹6.69 crore = ₹1.84 crore
10. Profit After Tax (PAT)
Net Profit = PBT – Tax = 6.69 – 1.84 = ₹4.85 crore
This is the final profit—and it’s called the bottom line because it appears at the bottom of the P&L statement.
So that’s how you read a real Profit and Loss statement—line by line, with full clarity.
Once you understand what each number means and how it connects to the rest, you stop guessing.
You stop relying on tips, headlines, or opinions.
You start thinking like a real investor—calm, clear, and data-driven.

8. Standalone vs Consolidated Profit and Loss Statement
There are two types of Profit and Loss (P&L) statements you’ll come across — standalone and consolidated.
Suppose you run a restaurant business in India. That’s your parent company.
Now, you expand and open more companies in the USA, London, Germany, and Japan.
These are your subsidiaries — separate legal entities, but owned by your Indian company.
Here’s the key difference:
- The standalone P&L shows how your Indian company is doing.
- The consolidated P&L combines the performance of your parent company and all your subsidiaries. It shows how your entire business is doing as a group.
So, which one should you focus on?
Always look at the consolidated P&L. That’s the one that tells you the real story — how the entire business is performing, not just one part of it.

Consolidated P&L shows the full picture.
9. Practical Insights From Profit And Loss Statement
The profit and loss statement reveals key details that help you understand the company better.
9.1 Nature of the Business
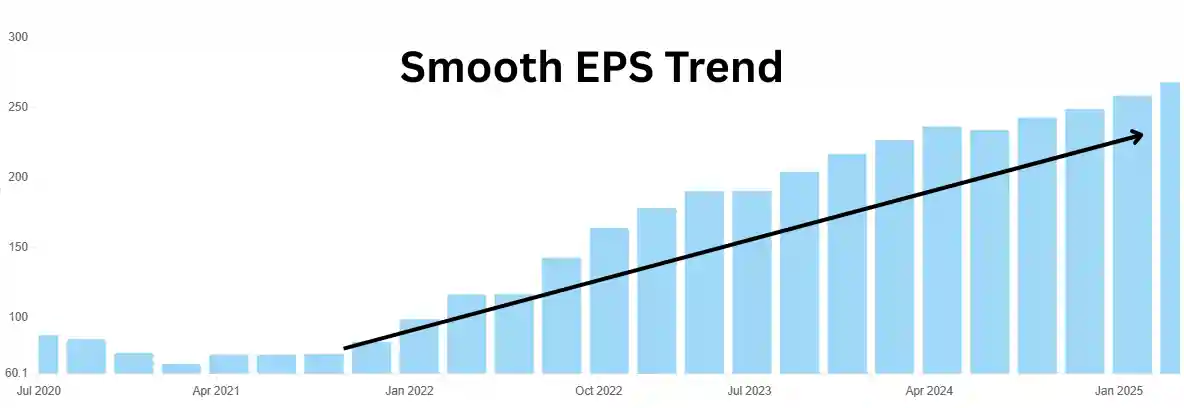
Just by looking at the EPS (Earnings Per Share) chart, you can understand the kind of business you’re dealing with.
Take Bajaj Finance, for example:

Its earnings move up smoothly, year after year. That means the business is stable, predictable, and consistently growing.
These kinds of companies are easier to understand and analyze. Their stock prices also show the same smooth uptrend.

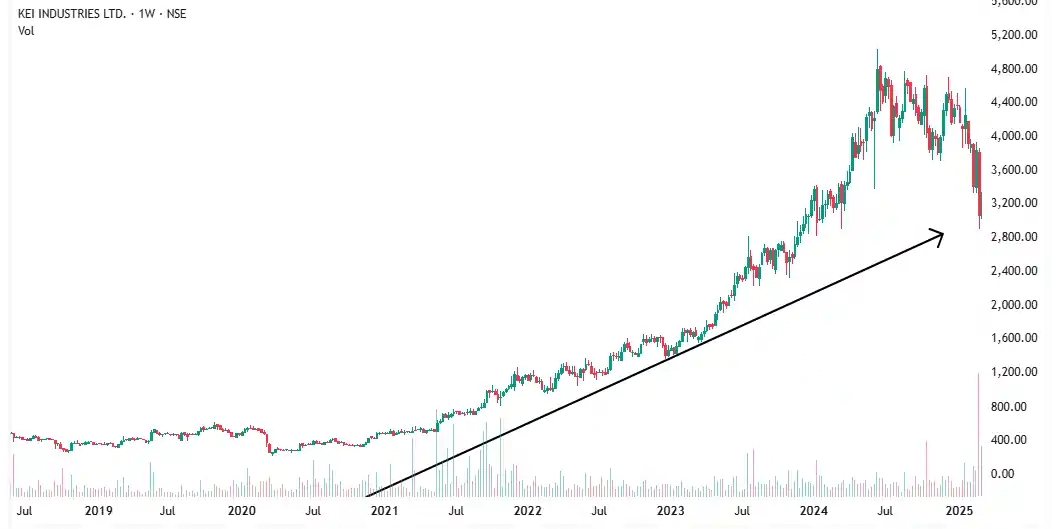
Another one is KEI Industries:

Same story here. A clean upward earnings trend. No major swings.
That’s why the stock has also gone up steadily.

Now compare that to Tata Steel:

The EPS is all over the place—up one year, down the next.

The stock price follows the same messy pattern.
Hard to make sense of. Harder to hold with confidence.
Volatile EPS = Hard to Read
Consistent EPS = Easy to Understand
That’s why EPS matters. It reflects how a business behaves over time.
And the pattern often shows up in the stock price too.
Volatile EPS means volatile business. Stay cautious.
9.2 To Compare Two Businesses
Operating profit margin helps you compare companies in the same industry.
Let’s look at two examples.
This is profit and loss statement of page industries.

Page Industries maintains a steady operating margin of 18–22%. That’s high and consistent.
Now look at Lux Industries:

Its margins stay around 10–12%, except for a spike in 2022 and 2023.
Both companies make similar products. But Page Industries clearly does better.
Why?
Either it has stronger brand power and charges a premium, or it runs more efficiently.
In both cases, higher operating margin gives the company an edge.
It’s a sign of quality, control, and pricing power.
That’s why comparing margins isn’t just about numbers—it’s about understanding who’s really winning in the market.
9.3 Strong Competitive Advantage
When a company keeps increasing its operating profit margin year after year, it shows strong competitive advantage.
This usually means one of two things: The company has become more efficient and cut costs Or it has pricing power and can raise prices without losing customers
Take Polycab for example:

In 2014–2015, its operating margin was around 8–9%. Over time, it rose to 13–14%.
That’s a clear improvement.
It shows the business is well-run and getting stronger.
Now look at the stock:

A steady uptrend—strong operations often show up in the stock price.
Operating margin isn’t just a number. It reflects how powerful the business really is.
Consistently increasing margins signal a strong, well-run company.
9.4 Avoid Risky Companies
You can spot weak companies just by comparing operating profit with interest expenses.
Look at Vodafone India:

In March 2024, it made an operating profit of ₹17,072 crore. But its interest cost was ₹25,766 crore.
Pause and think about that.
The company earns ₹17,000 crore from its business, but it has to pay over ₹25,000 crore just in interest.
That’s more than it makes. Just in interest.
So what does it do?
It borrows more money—just to pay the interest. And this debt trap usually leads to one outcome: bankruptcy.
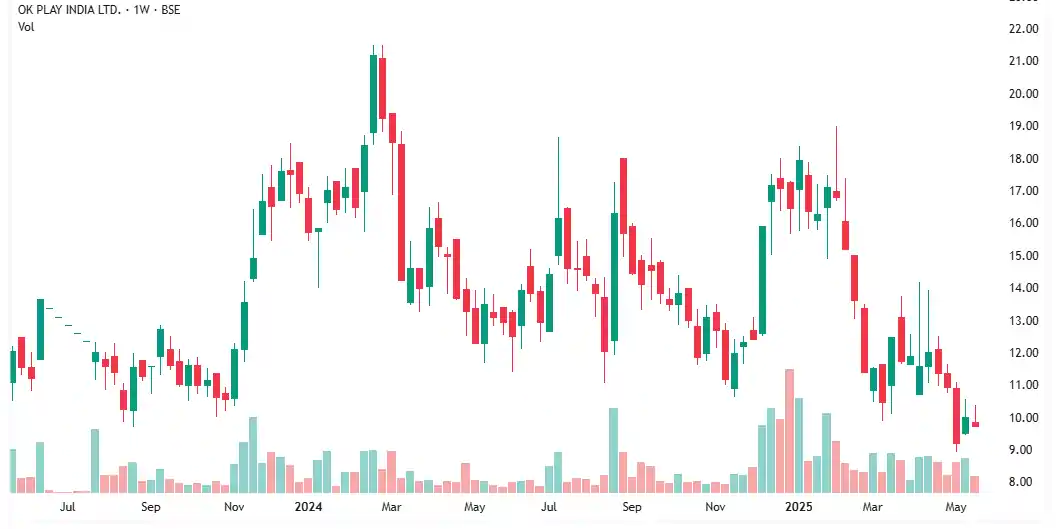
Here’s another example—OK Play:

In 2024, it made ₹35 crore in operating profit. But paid ₹15 crore in interest.
That’s over 40% of its earnings gone—just to pay debt.
Now look at the stock:

Massive volatility. Wild price swings. That’s what happens when debt runs the show.
By simply understanding the P&L, you can avoid these traps.
You don’t need advanced analysis—just common sense and the right lens.
In future articles, we’ll go deeper.
I’ll show you how to combine the P&L with the balance sheet to uncover even more.
You’ll learn to spot companies that are truly strong—and avoid those that are fundamentally weak.
If interest cost is higher than operating profit, run.
10. Beware of This Trap
Let’s say you run a restaurant business.
You bought a piece of land, thinking you’d open a new outlet. But later, you changed your mind and sold it.
The money you make from selling that land is shown as an exceptional item in the P&L.
Why?
Because it’s not part of your core business. It’s a one-time income.
That’s the trap.
This kind of income boosts your profit artificially. It looks good on paper—but it won’t happen again.
So, when you look at the net profit, always subtract any exceptional item.
Otherwise, it gives a false impression of the company’s true performance.
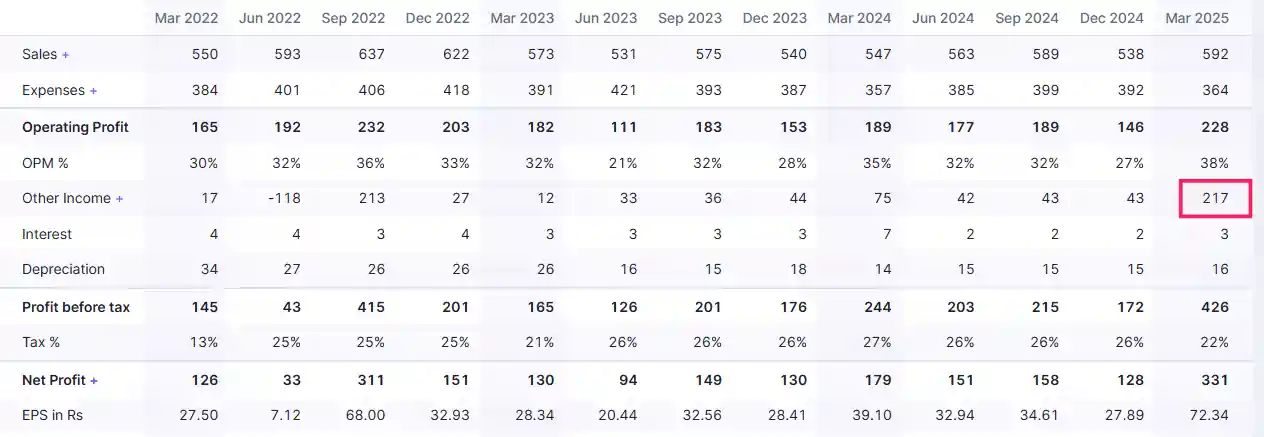
Here’s a real example from Pfizer:

See that jump in net profit?
It’s because of an exceptional income—not regular business.
A beginner might think, “Wow, profits are up!”
But the reality is—this profit won’t repeat. It’s not from normal operations.
Now look at another case—June 2022:

Here, net profit dropped sharply due to a one-time loss. Again, this isn’t part of regular business either.
In both cases—whether profit jumps or falls—always check for exceptional items.
Remove them.
Only then you’ll see the real profit.
Don’t fall for artificial highs or lows.
Look deeper. That’s how you avoid costly mistakes.
Net profit boosted by one-time gains is a trap.
11. Conclusion
The Profit and Loss statement isn’t just about numbers—it tells the story of how a company earns, spends, and survives.
Once you learn to read it the right way, you stop guessing.
You start seeing what others miss:
— Which businesses are truly strong
— Which ones are struggling under the surface
— And which ones are best avoided
Keep your eyes on the right numbers.
Ignore the noise.
And you’ll start making decisions with clarity and confidence.
🟠 Still Have a Doubt? Let’s Solve It Together.
Learning is powerful — but asking the right questions is what turns knowledge into results.


Most traders stay stuck because they never ask. Don’t be one of them.
Ask me directly here — and I’ll personally help you move forward.