Support and Resistance (SNR)

By Sachin Malik
Most traders draw random lines on their charts and call them support or resistance.
But when the price gets there, it often does the opposite of what they expect.
That’s because they’re not identifying real zones — just guesses.
In this article, you’ll learn how to spot strong support and resistance (SNR) zones that actually work.
Table of Contents
TogglePart 1. How Support And Resistance (SNR) Helps You In Trading
Support and Resistance (SNR) can help you in two key ways:
1. Estimating How Much a Stock Can Fall:
When a stock is falling, it’s hard to know where it might stop.
SNR helps you find likely support zones — areas where the price is expected to stabilize or bounce.
This way, you can assess the downside risk clearly and avoid emotional decisions.
2. Finding the Right Time to Buy:
Breaking a resistance zone takes real strength. When a stock crosses a strong resistance, it signals strong buying pressure.
By spotting this breakout, you can time your entry better and ride the move with higher confidence.
Part 2. What is Support and Resistance Zone (SNR)?

Let’s understand it with a simple example:
Imagine a stock is going up. It reaches Point A, then turns down and falls to Point B.
People who bought at Point A are now stuck with losses. They had expected profits, but the stock went down instead.
Now they are hoping the stock will rise back to their buying price so they can exit without a loss.
As the stock starts recovering and moves toward Point C (near Point A), these trapped buyers get their chance.
They start selling to recover their money.
This selling creates pressure and makes it hard for the stock to go higher.
This selling pressure creates a resistance zone.
At the same time, some traders at Point B wanted to buy earlier but didn’t, because they were afraid the stock would fall more.
Now they regret missing the opportunity as they watch the stock move higher.
They don’t want to buy at higher prices.
They are waiting for the stock to fall back near Point B.
When the stock drops from Point C and comes near Point D (around the same level as Point B), these waiting buyers jump in.
Their buying creates demand and makes it hard for the stock to fall further.
This buying pressure creates a support zone.
In simple words: Selling pressure creates resistance zone. Buying pressure creates support zone.
The stock moves up and down between these zones until something big happens.
If strong buyers step in at resistance, the stock can break through and move higher.
If strong sellers step in at support, the stock can break down and move lower.
Support and resistance zones are created because traders have a memory.
They remember where they bought, where they sold, and where they missed their chance.
And they act when the price comes back to those levels.
Real life example:

Part 3. How To Identify Support and Resistance Zones (SNR)

In Dow Theory, you learned about swing highs (SH) and swing lows (SL).
Now, you will use these swing points to identify support and resistance zones (SNR).
Imagine a stock moving upward. It then reverses and forms Swing High 1 (SH1).
The stock falls, then finds support and reverses again, forming Swing Low 1 (SL1).
As the stock rises once more, the previous SH1 acts as a potential resistance zone.
Why?
Because traders who bought near SH1 may want to sell and exit at breakeven when the price returns to that level.
If the stock moves up and forms another Swing High 2 (SH2) around the same price as SH1, now you have two swing highs at a similar level.
By joining SH1 and SH2, you can mark a resistance zone.
Important Rule: You need at least two swing points at a similar price to confirm a zone.
- Two swing highs (SH1 and SH2) → Resistance Zone
- Two swing lows (SL1 and SL2) → Support Zone
Every SH acts as a potential resistance, and every SL acts as a potential support.
But to officially mark it as a zone, you must spot two swing points near the same price level.
Part 4. Role Reversal Of Support And Resistance (SNR)
Support and resistance zones are not fixed forever.
When the price breaks through a support zone and falls below it, that support often turns into a new resistance.
Similarly, when the price breaks above a resistance zone, that resistance often becomes a new support.
This role reversal happens because of shifts in trader behaviour at those key price levels.
4.1 Previous Support Becomes New Resistance Zone

Suppose you have two swing lows on the chart — Swing Low 1 (SL1) and Swing Low 2 (SL2).
These two points together form a support zone, and the price is currently above this zone at Point A.
Now, the price starts falling.
Instead of stopping at the support zone, the price breaks below it and forms a new Swing Low 3 (SL3) before turning back upward.
At this point, traders who bought at SL1 and SL2 are now sitting at a loss.
When the price rises back toward the old support zone, these traders will look to sell at breakeven to avoid booking a loss.
As a result, the previous support zone now acts as a resistance zone.
When the price reaches this level at Point B, selling pressure increases, and the price starts falling again.
This is how the role reversal of support and resistance happens: Old support becomes new resistance.
Real life example:

4.2 Previous Resistance Becomes New Support Zone

Suppose you have two swing highs on the chart — Swing High 1 (SH1) and Swing High 2 (SH2).
These two points together form a resistance zone, and the price is currently below this zone at Point A.
Now, the price starts rising.
Instead of stopping at the resistance zone, the price breaks above it and forms a new Swing High 3 (SH3) before pulling back.
Traders who missed the breakout may look to enter when the price comes back to the previous swing high so they can buy it.
When the price pulls back to this level at Point B, buying pressure increases, and the price starts rising again.
As a result, the previous resistance zone now acts as a support zone.
This is how the role reversal of support and resistance happens: Old resistance becomes new support.
Real life example:

4.3 A Simple Metaphor: Roof Becomes the Floor
Imagine you are standing on the first floor of an apartment building.
Above you, there is a roof.
You cannot go higher — the roof is stopping you.
That’s how resistance works — it blocks the price from going up.
Now suppose you find a staircase and climb to the second floor.
What happens to the same roof?
It now becomes the floor under your feet.
It is no longer stopping you — it is supporting you from below.
Support and resistance zones work exactly like this:
- When the price is below a level, it acts as a roof (resistance).
- When the price breaks above, the same level becomes the floor (support).
The level stays the same — but the way it behaves changes depending on where the price is.
Part 5. Myth 1: Support and Resistance Is a Line
When people hear the words support and resistance, they often imagine a single line at a fixed price.
They believe that if support is at ₹100, the stock will fall exactly to ₹100 and immediately bounce back.
But that’s not true.
This is a big fat myth.
Support and resistance (SNR) is not a line — it’s a zone.
Let’s take an example:
Suppose you notice two swing lows at ₹100 on the chart.
The stock is currently at ₹120 and starts falling.
Most people expect the price to fall exactly to ₹100, stop there, and bounce back.
But in reality, what happens?
- Sometimes, the stock finds support at ₹102 or ₹103.
- Sometimes, it goes below ₹100 to ₹97 or ₹95 before finding support.
The price will not always stop exactly at ₹100.
It can find support anywhere between ₹95 and ₹105.
That entire range — ₹95 to ₹105 — is the support zone, not just ₹100.
Similarly, if you spot two swing highs around ₹120, you can mark it as a resistance zone.
But don’t expect the stock to hit exactly ₹120 and reverse.
- Sometimes it will turn around at ₹117 or ₹118.
- Sometimes it may even stretch up to ₹123 before facing selling pressure.
The resistance zone could be anywhere between ₹117 and ₹123 — not a single price point.
Most traders make the mistake of drawing a thin line to represent support and resistance on their charts.
This is wrong.
Always use a thick rectangle to mark support and resistance zones.
It helps you think in terms of areas, not exact numbers — and matches real-world price behaviour.
5.1 Wrong Way To Mark Support And Resistance
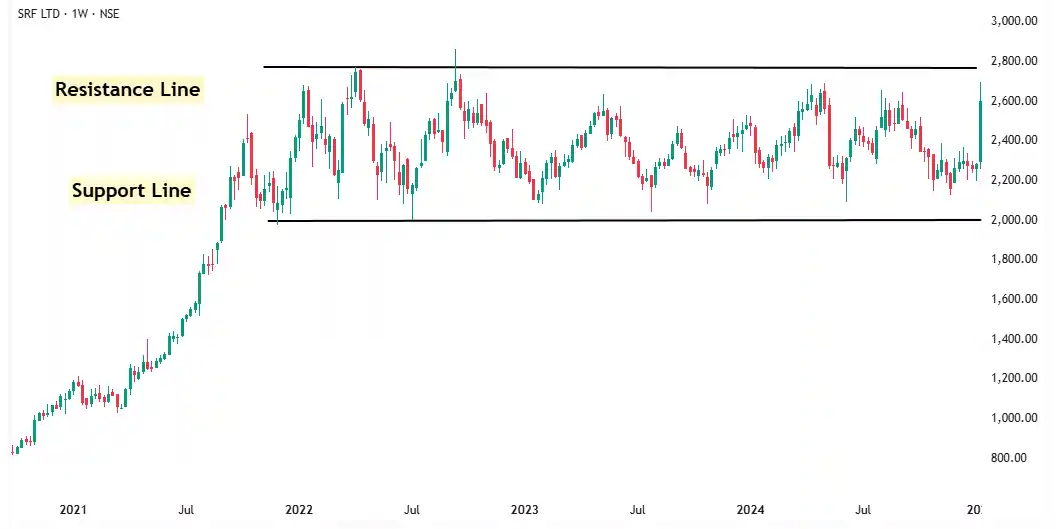
5.2 Right Way To Mark Support And Resistance
• Myth: Support and Resistance are lines.
• Truth: Support and Resistance are zones.
Part 6. Myth 2: Diagonal Support and Resistance Zones Work
One of the biggest myths about support and resistance is the belief that diagonal support and resistance works.
In the previous examples, we saw how horizontal support and resistance work:
You find two swing points at similar price levels and mark them as a zone.
This works because traders have memory — they remember where they bought and sold at clear price levels.
However, somewhere along the way, people started connecting two random swing points at different prices and called it a trendline.
They claimed these diagonal lines act as support or resistance.

This is completely false.
- The market does not recognize diagonal price levels.
- Traders do not think in angles. They remember round price numbers like ₹100, ₹120 — not slanted lines.
Trendlines are a tool that simply does not work.
Yet every technical analysis book, YouTuber, and influencer teaches them — even though they cannot make real money using trendlines.
They rely on hindsight bias to make trendlines look perfect:
- They pick two points where a trendline happens to fit after the move is over.
- Then they say, “Look how beautifully the trendline worked.”
But this is not real trading.
In real-time, trendlines will only confuse you and cause losses.
Trendlines create false hope. Trendlines create confusion. Trendlines are based on hindsight, not reality.
You should avoid trendlines completely.
Avoid all chart patterns and strategies that are based on diagonal lines.
Focus only on horizontal support and resistance zones if you want to succeed.
• Diagonal support and resistance does not work, only horizontal support and resistance works.
• Avoid trendlines completely.
Part 7. A Powerful Idea
Most traders know how to draw a support or resistance (SNR) zone.
But very few know how to judge whether that zone will hold — or break.
That’s the real game.
The good news is: there’s a simple way to tell.
By using this idea, you’ll be able to spot when an SNR zone is getting weaker — and predict when the market is most likely to break through it.
This one skill alone can save you from false hopes and costly losses — and give you a real trading edge.
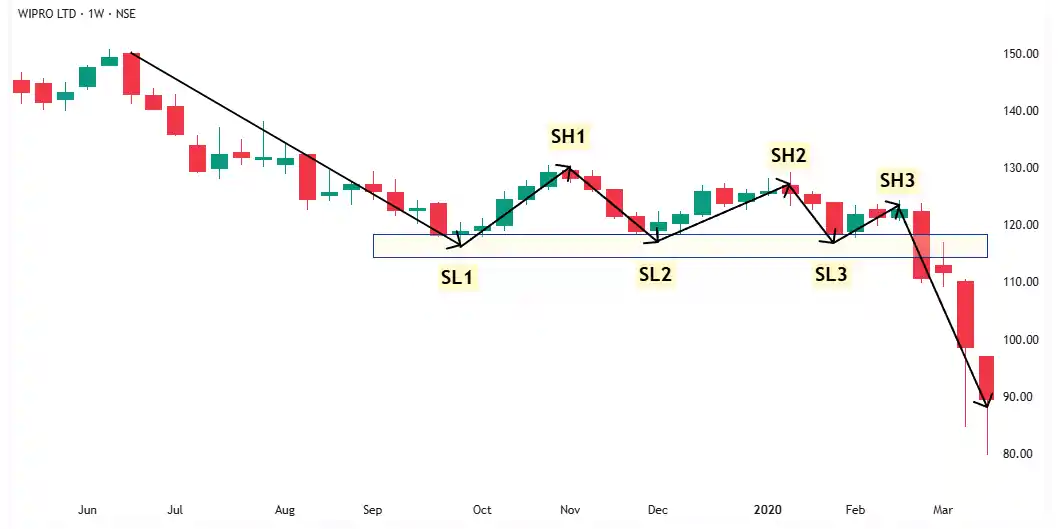
7.1 When a Support Zone is About to Break

Let’s walk through it step-by-step:
- The market is falling and makes a Swing Low 1 (SL1).
- Then it pulls back upward and forms a Swing High 1 (SH1).
- The price falls again, reaching close to the previous low and creates Swing Low 2 (SL2).
Now you have two swing lows at a similar price level —
this area becomes your support zone.
The price now tries to bounce again —
but this time, it forms Swing High 2 (SH2) lower than Swing High 1.
This is a warning sign.
A lower high tells you that sellers are gaining strength, and buyers are getting weaker.
When buyers can’t even push the price back to the previous high, it shows selling pressure is building.
In simple words:
- A lower high = weak buyers + strong sellers.
- This increases the chances that the support zone will break.
Whenever you spot a series of lower high near a support zone, be cautious: the market is most likely to break down.
Real life example:
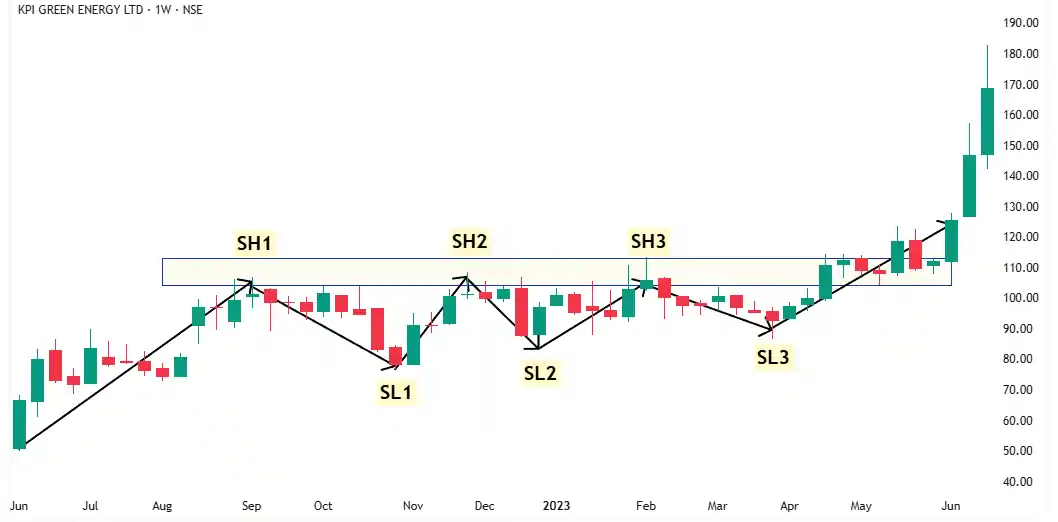
7.2 When a Resistance Zone is About to Break

Let’s walk through it step-by-step:
- The market is rising and makes a Swing High 1 (SH1).
- Then it pulls back downward and forms a Swing Low 1 (SL1).
- The price rises again, reaching close to the previous high and creates Swing High 2 (SH2).
Now you have two swing highs at a similar price level —
this area becomes your resistance zone.
The price now pulls back —
but this time, it forms Swing Low 2 (SL2) higher than Swing Low 1.
A higher low tells you that buyers are gaining strength, and sellers are getting weaker.
When sellers can’t even push the price back down to the previous low, it shows buying pressure is building.
In simple words:
- A higher low = strong buyers + weak sellers.
- This increases the chances that the resistance zone will break.
Whenever you spot a series of higher lows near a resistance zone, get ready — the market is gearing up for a powerful breakout.
Real life example:
Part 8. Weakness of Support and Resistance Zones (SNR)
In the previous sections, you learned how Support and Resistance (SNR) zones work — and how they can give you an edge in trading.
But like every tool, SNR zones have their strengths and weaknesses.
Support and resistance do not work all the time.
Sometimes they work beautifully.
Sometimes they completely fail — and leave you scratching your head wondering,
“Why didn’t it work this time?”
It can be frustrating.
But here’s the truth: Support and resistance are not meant to work every time.
When you use SNR zones, you must think in terms of probabilities, not certainties.
That’s the mindset of a professional trader.
Instead of saying, “This zone will definitely hold,”
you should say, “There’s a 70% probability that this zone will hold.”
Thinking this way keeps you calm — even when things don’t go as expected.
8.1 Why Strong SNR Zones Sometimes Break
Let’s say you identify a very strong support zone on a chart.
But suddenly, some bad news comes out about the company —
bad earnings, negative future outlook, or a regulatory issue.
Traders panic.
They start selling heavily.
The strong-looking support zone collapses.
It’s not because you analyzed the chart wrong.
It’s because the fundamentals changed — and no technical level can stop a flood of fear.
This is why price action alone is not enough. Relying only on price action is a mistake.
8.2 How to Cover This Weakness
In Step 4 — Fundamental Analysis — I’ll show you how to improve your accuracy by checking key fundamentals.
When you combine Support and Resistance zones with Basic Fundamental Analysis, You unlock a whole new level of understanding.
You stop seeing random lines on a chart.
You start seeing what traders are thinking.
You start understanding why they are buying or selling.
By simply adding a basic layer of fundamentals, you greatly increase the probability that your support and resistance zones will hold.
You fix one of the biggest weaknesses of pure technical analysis.
Conclusion
Support and Resistance zones are one of the most powerful tools in trading.
But only when you understand how they form, when they fail, and how to think in probabilities, not certainties.
When you combine SNR with basic fundamentals, you stop guessing —
and start reading the true story behind every price move.
It’s not just about drawing zones anymore — it’s about trading with insight and clarity.
🟠 Still Have a Doubt? Let’s Solve It Together.
Learning is powerful — but asking the right questions is what turns knowledge into results.
 Confused about something you just read? Not sure how to apply it to your trading journey?
Most traders stay stuck because they never ask. Don’t be one of them.
Ask me directly here — and I’ll personally help you move forward.
Keep Learning
Next Lesson: Two Powerful Setups