The Pyramiding Technique

Pyramiding Technique

Most traders are obsessed with high win rate.

They keep chasing strategies that win 90–95% of the time.

Why?

Because they’ve been trained since childhood that anything below 90% is failure.

If you scored 89 in your exam, you were told to “work harder.”

You were not a topper. You were not enough.

So now, in trading, they carry the same belief.

They think they need a 90%-win rate to be successful. They think losses mean they’re doing something wrong.

That they’re not good enough. Not smart enough. Not disciplined enough.

And this belief destroys them.

They can’t sleep at night after a loss. They keep tweaking their strategy after every losing trade.

They switch systems. They binge-watch videos. They rewrite rules.

They’re always chasing that next magic formula.

Their mind is never at peace. They feel stuck in a loop. Profits stay small. Confidence stays low. And the frustration just keeps building.

And worst of all—

they start thinking they are the problem.

Not the strategy. Not the market. Them.

But here’s the truth:

You don’t need more winners to make more money.

You don’t need a 95% win rate. You just need to make your winners bigger.

Same strategy.

Same trades.

Same win rate.

But bigger profits.

How?

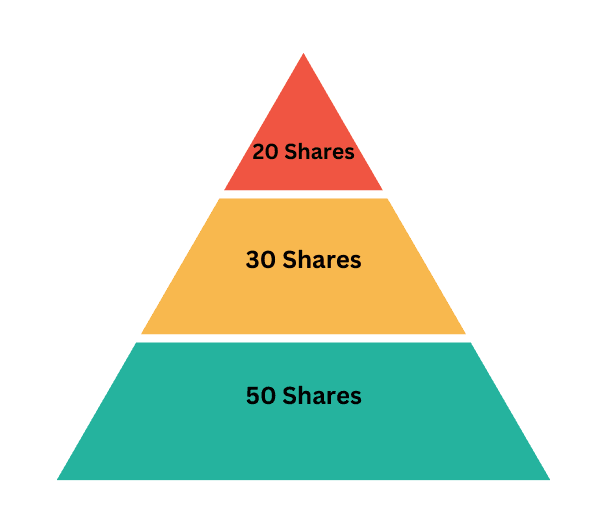
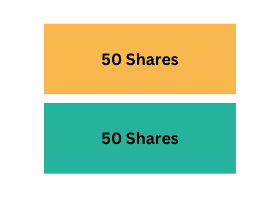
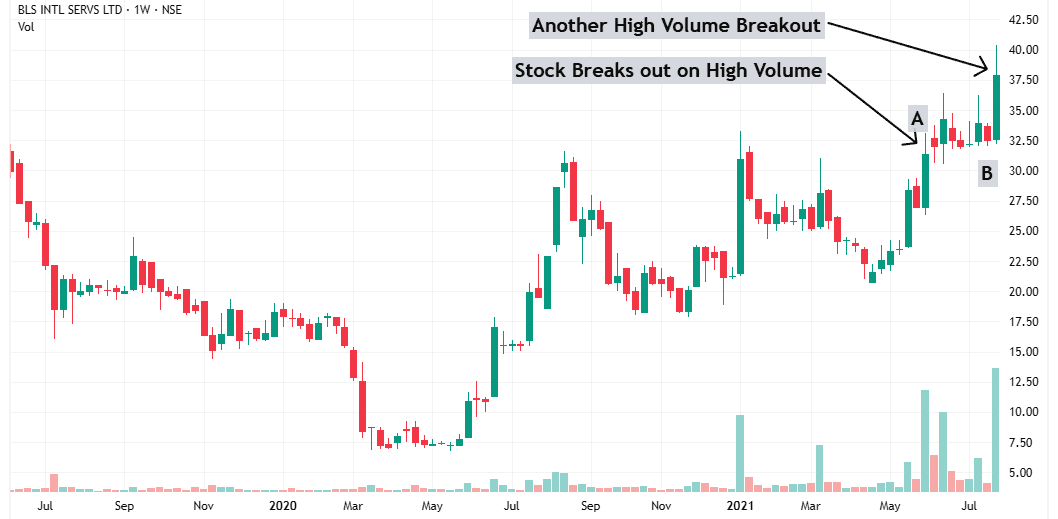
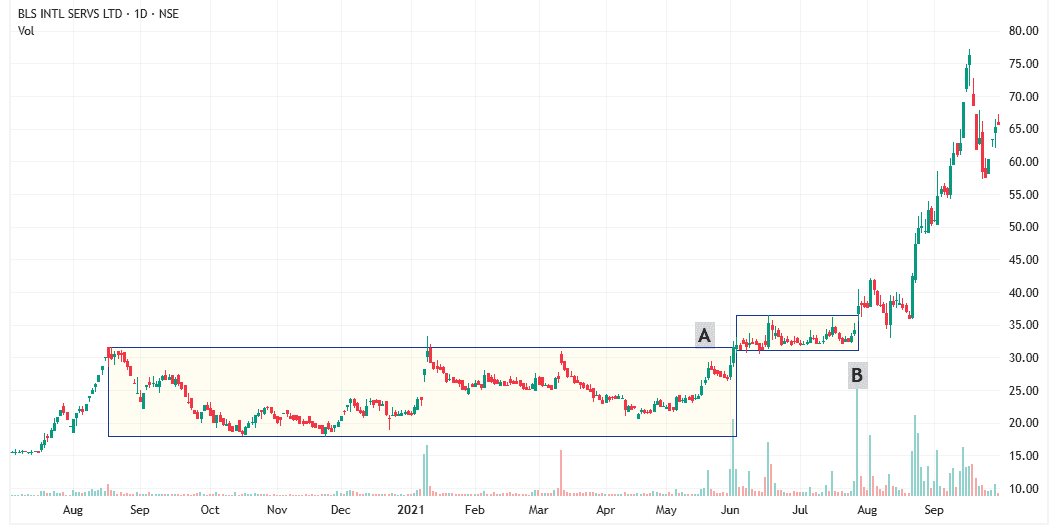
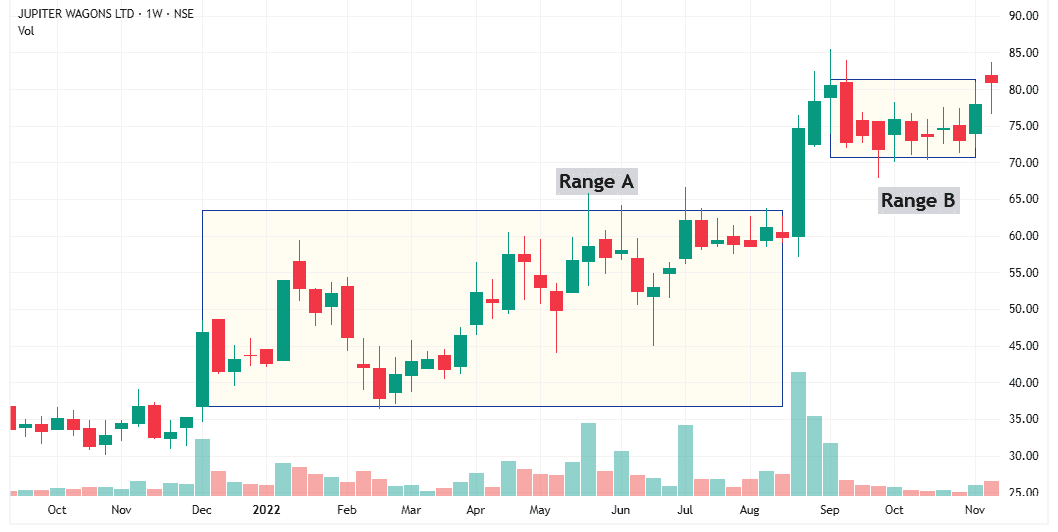
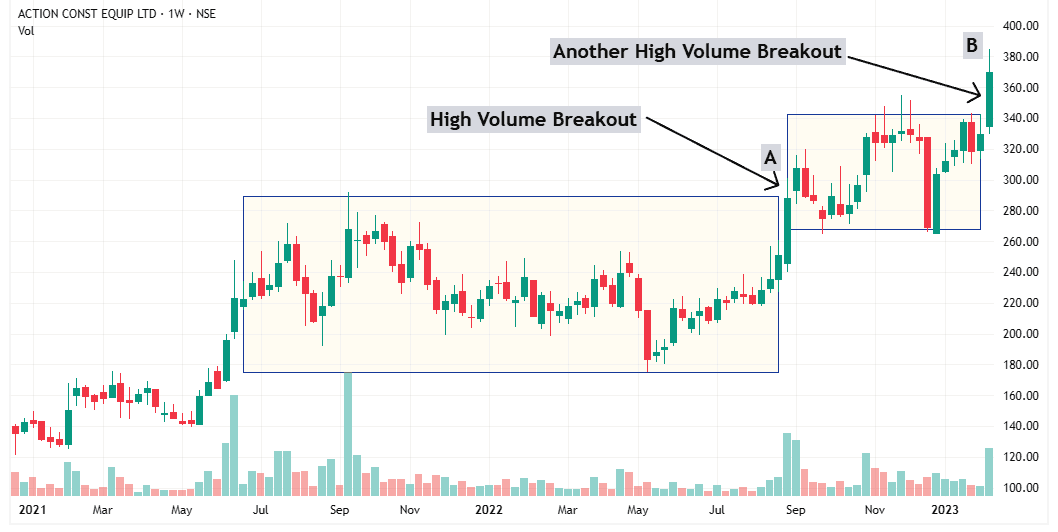
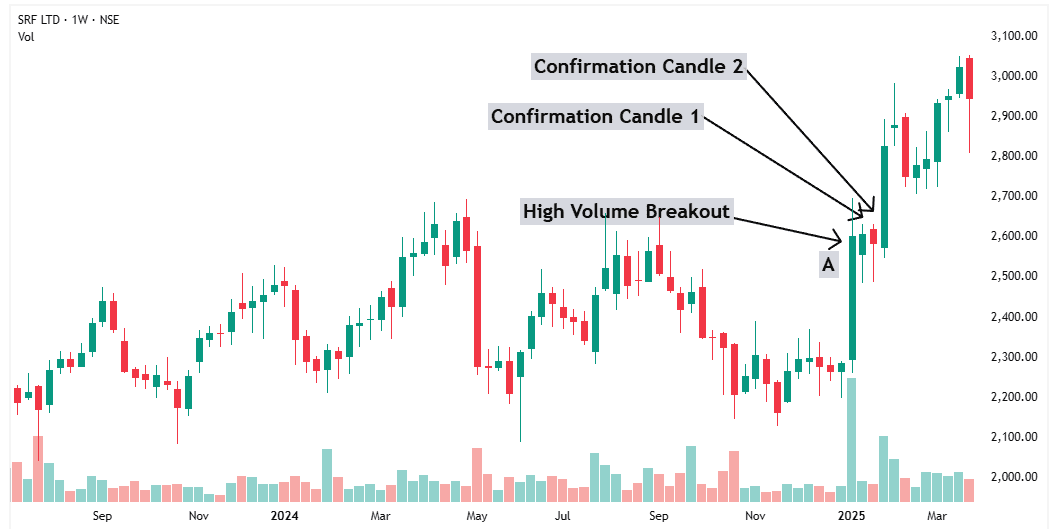
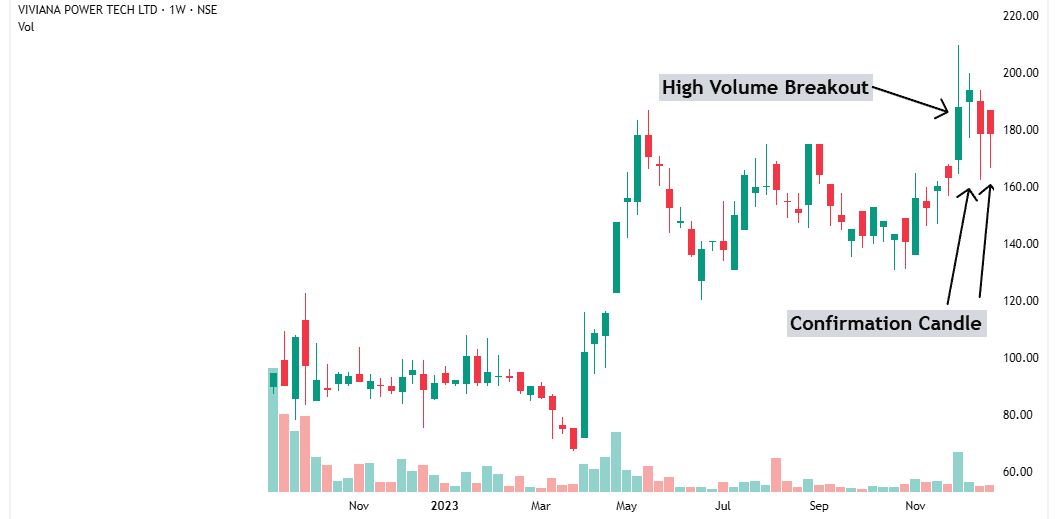
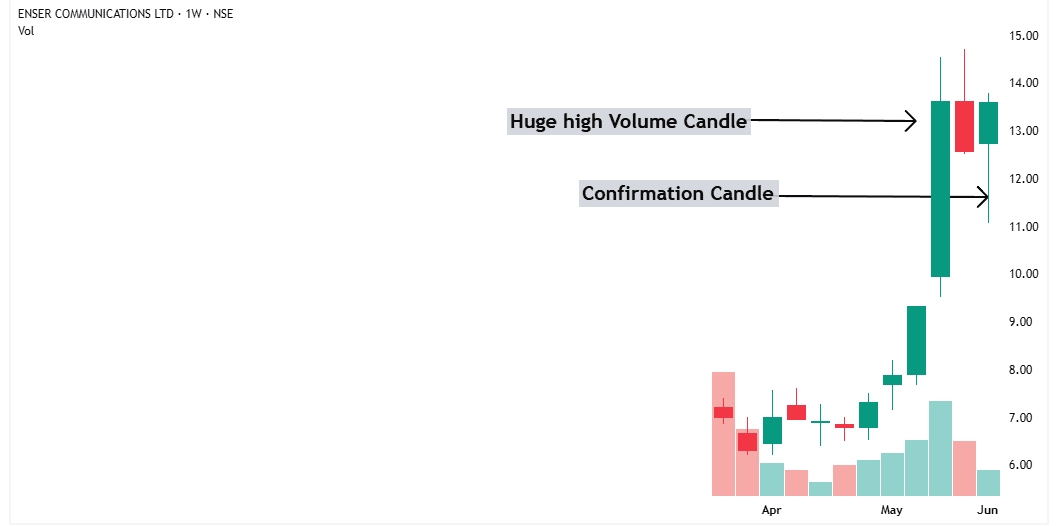
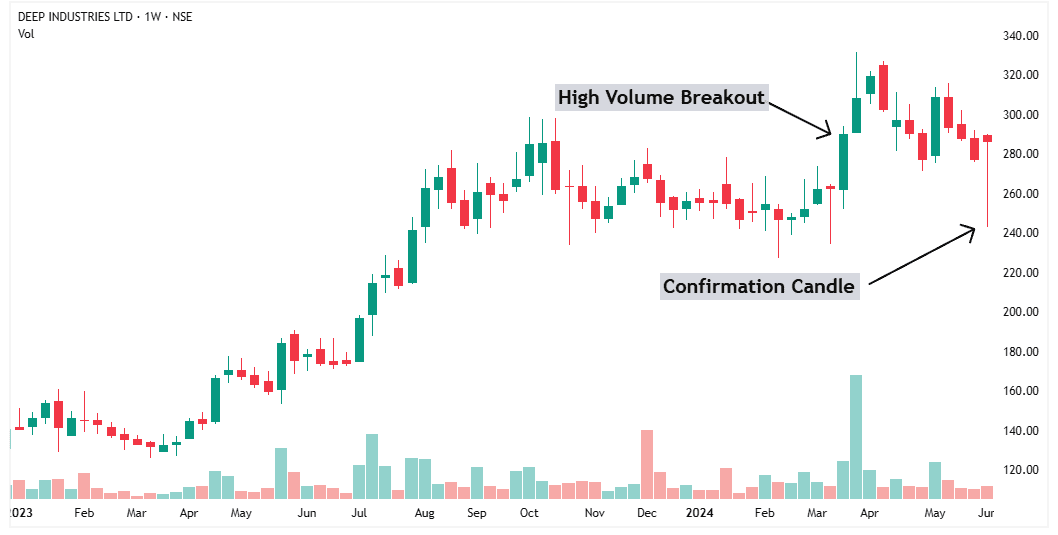
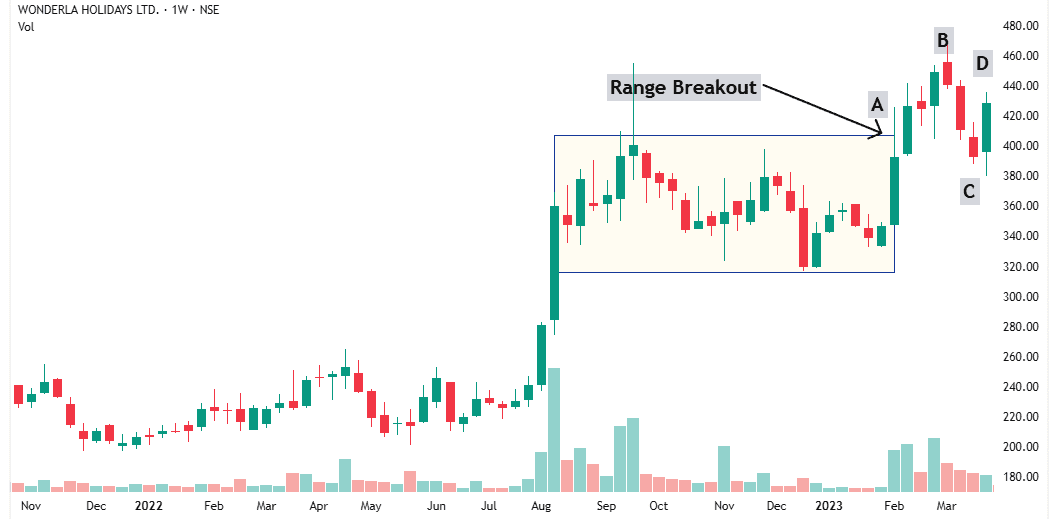
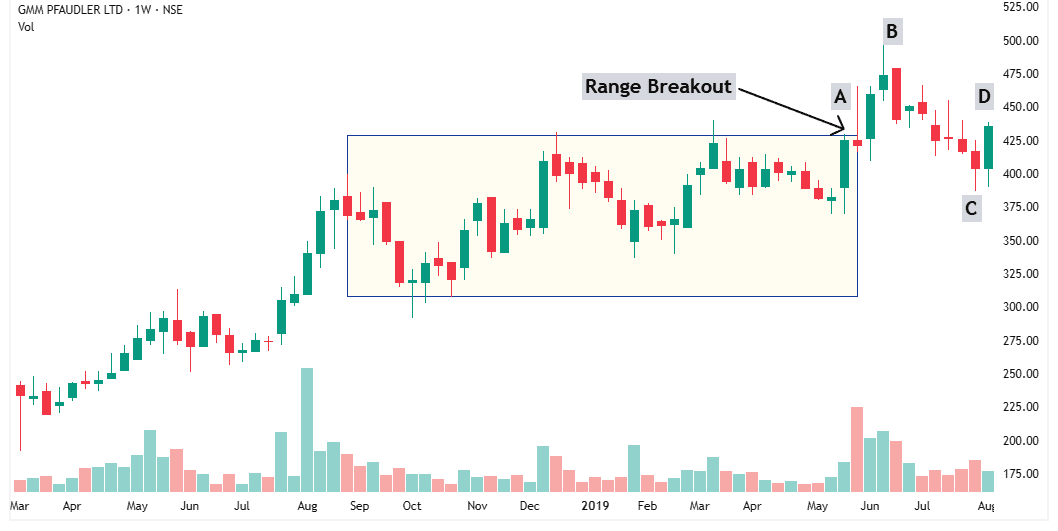
By using the Pyramiding Technique.

Pyramiding turns your good trades into monster tradesIt’s like adding fuel to a fire that’s already burning. .

You don’t need to be perfect.

You just need to know how to press the accelerator when the trade is working.

That’s how top traders make their fortune.

Let me show you how.

What is a Pyramiding?

Pyramiding is a technique where a trader adds more shares when the price confirms their expectations.

Let’s say you want to buy 100 shares. Instead of buying all at once, you start small—maybe 50 shares.

Then, if the trade confirms your expectations, you buy 30 more shares.

Later, when things are still going well, you buy the last 20 shares.

This method is called pyramiding because the way you add shares looks like a pyramid.

pyramid 3

It is also called ‘Scaling in’ technique because you are scaling in the position.

With pyramiding, you don’t increase risk blindly. You wait for confirmation, then add more.

Flat Pyramiding

I like to keep things simple, so I use a method called flat pyramiding.

It means I divide my position into two equal parts.

I buy the first half when I get a strong setup.

Then I wait.

50 Shares

If the market moves as expected and confirms the trade, I buy the second half.

This way, I don’t go all in at once.

If the trade goes against me after the first entry, my loss stays small and manageable.

But if the trade works and I add more, I’ve amplified my winner—and made more profit from the same trade.

You can split your position into 2, 3, or even 4 parts, depending on your comfort level.

But for me, two equal parts keep it simple, clear, and easy to manage.

Amplify Your Winners

Let’s take two traders, both with a ₹10 lakh portfolio. Each takes 10 trades, risking ₹1 lakh per trade.

Their win rate is the same: 4 wins and 6 losses.

Every time they win, they make 50%, and every time they lose, they lose 10%.

Trader A (Equal Betting on All Trades)

  • Wins: 4 trades × ₹50,000 profit = ₹2 lakh
  • Losses: 6 trades × ₹10,000 loss = ₹60,000
  • Net Profit: ₹1.4 lakh

Trader B (Amplifies Winners)

Now, imagine Trader B can spot two strong winners early. Instead of putting ₹1 lakh in each trade, he increases his position size in those two winners.

  • He puts ₹1.5 lakh in two strong winners and ₹1 lakh in the other two winners.
  • His four winning trades now hold ₹5 lakh instead of ₹4 lakh.

His profit changes:

  • Wins: ₹5 lakh × 50% = ₹2.5 lakh
  • Losses: ₹5 lakh × 10% = ₹50,000
  • Net Profit: ₹2 lakh

Same trades. Same win rate. But ₹60,000 more profit!

By identifying a winning trade early and betting more on it, you can amplify your winners.

You don’t need a new system—you just need to squeeze more from the trades already working.

The key to finding a winning trade early is to wait for the market to confirm it. Once the market confirms your trade then you buy more shares.

Pyramiding Points

Pyramiding points are the moments when you can safely add more shares because the market is confirming your expectation.

By finding good pyramiding points, you can add more money to winning stocks and make bigger profits.

Over time, I’ve found three pyramiding points that work well in actual trades:

1. Pyramiding Point 1: Range over Range

2. Pyramiding Point 2: Candle Confirmation

3. Pyramiding Point 3: The First Pullback

I didn’t learn these from any book.

I discovered them through experience—by observing what actually works.

If I come across more effective pyramiding points, I’ll update them here.

Let’s explore these three pyramiding points one by one and see how you can use them to amplify your winners.

Pyramiding Point 1: Range Over Range

When a stock trades between ₹700 and ₹1000 for a long time—say a year—that’s called a range.

Now imagine the stock finally breaks above ₹1000. But instead of flying higher, it forms a smaller range between ₹1000 and ₹1100.

That smaller range is a big clue.

Here’s what’s happening behind the scenes:

When a stock breaks out after a long range, many old investors who were stuck at higher prices start selling to exit. 

This creates supply.

If big institutions are really buying, they absorb this selling. They don’t let the price crash—but they don’t push it too high either. 

The stock just sits there, moving in a tight range.

This is smart money at work—accumulating quietly.

Once that supply dries up, the stock breaks out again—this time from the smaller range.

That’s your confirmation.

The market is telling you: This trade is working. Add more shares.

Example 1: BLS International services

BLS_2025-03-27_17-07-23

 In the chart, you’ll see a big breakout at Point A.

But instead of running up, the stock forms a tight 7-week range.

This is your Range over Range setup.

That narrow range signals strength. The stock is holding up. Buyers are in control.

Then, it breaks out from that smaller range at Point B.

That’s your signal to increase your position.

BLS_2025-03-27_17-11-04

On the daily chart, you’ll see a smaller range forming right above the larger one.

So, what’s happening here?

Institutions are quietly stepping in. They’re not letting the price fall.

That’s your confirmation. The market is saying: This trade is working — add more.

Example 2: Jupitor Wagons

JWL_2025-03-27_17-20-53

Same story.

A big range at the bottom (Range A), then a smaller one on top (Range B).

When stock breaks out of Range B, that’s confirmation to buy more.

The stock is strong—and the breakout is real.

Example 3: Action Construction Equipment

ACE_2025-03-27_17-14-39

The stock breaks out of a large base at Point A, and immediately forms a smaller range.

Once it breaks out again at Point B, the message is clear:

The market is supporting your trade. It’s time to pyramid.

Pyramiding Point 2: Candle Confirmation

When a stock breaks out with a strong candle and high volume, that’s the perfect start.

But after a sharp move, it’s normal for the stock to pull back a little.

Don’t panic—that dip can give you your next big opportunity.

So, what’s happening here?

If institutional investors are serious about buying, they won’t let the stock fall much. 

As soon as the price dips, they start buying again—pushing the stock back up.

By the end of the week, the stock forms a bullish candle. That’s the market’s way of saying: “This trade is working.”

If you see this kind of recovery, it’s a strong sign that big players are aggressively accumulating.

That’s your confirmation. That’s your pyramiding point. It’s time to buy more shares.

Example 4: SRF

SRF_2025-03-27_17-33-59

At Point A, the stock breaks out with a powerful candle and high volume.

Then comes the test: the stock dips—but doesn’t crash.

Instead, buyers step in and push it back up, forming a bullish candle.

The next week? Same story. A small dip, then a strong close. Another bullish candle.

Two bullish candles in a row = two confirmations.

The stock is being supported by strong hands.

That’s your cue to add more shares.

Example 5: Viviana Power Tech

VIVIANA_2025-03-27_17-35-26

After breaking out of a range with volume, the stock dips slightly and forms a bullish candle.

In week 3, it dips further—even goes below the breakout candle’s low. But institutions step in again.

The price rebounds. Another bullish candle forms.

In week 4, the same thing happens—dip, followed by buying.

These multiple confirmations tell you that institutions are buying aggressively.

Time to pyramid. The breakout is real.

Example 6: Enser Communications

ENSER_2025-03-27_17-44-04

Classic setup.

Strong breakout candle with high volume.

In the following weeks, the stock pulls back slightly but closes strong and forms a confirmation candle.

Institutions are buying the dip.

They’re not letting the stock fall.

This is the market saying: We’re going higher.

A perfect moment to add more.

Example 7: Deep Industries

DEEPINDS_2025-03-27_17-45-06

The stock breaks out, moves up slightly, and then pulls back.

It drops all the way to the low of the breakout candle—panic sets in.

But before the week ends, buyers step in hard.

The stock closes strong, forming a confirmation candle.

This is your signal: institutions are protecting the breakout. This is your cue to add more shares.

Pyramiding Point 3: The First Pullback

When a stock breaks out of a range with a strong candle and high volume, it usually moves up for a few days.

Then comes the test: the first pullback.

Watch this carefully.

The breakout level should now act as support.

If the stock pulls back to this level and holds—it’s a good sign.

Even better, if you see a bullish candle form there, it means institutional buyers are stepping in again.

The market is confirming the breakout.

This is a strong pyramiding point—it’s time to add more shares.

Example 8: Wonderla

WONDERLA_2025-03-27_17-57-53

At Point A, the stock breaks out on high volume.

It rises to Point B, then pulls back to Point C.

Now here’s the key moment:

This pullback returns to the breakout zone. If institutions really bought at Point A, they’ll likely defend it again.

And that’s exactly what happens—at Point D, a bullish candle forms.

That’s your confirmation.

The breakout is holding. This is the First Pullback Setup—a great time to add more shares.

Example 9: GMM Pfaudler

GMMPFAUDLR_2025-03-27_17-54-52

Breakout at Point A.

Quick rally to Point B, followed by a pullback to Point C.

At Point D, the stock holds support and forms a strong bullish candle.

A textbook First Pullback Setup.

Institutions are still buying. The trade is alive. Time to pyramid.

Example 10: HAL

HAL_2025-03-27_17-53-29

The same pattern repeats.

Breakout at Point A, rally to Point B, then a pullback to Point C.

At Point D, buyers return and push the price back up with a strong bullish candle.

The message is clear: the breakout is real, and the trade is working. A perfect moment to scale in.

I could show you hundreds of such examples.

Because while the stocks may change, the underlying logic stays the same.

Once you understand this setup, you’ll start spotting it everywhere—and you’ll know exactly when to add more shares.

Conclusion

You don’t need more winning trades.

You don’t need a strategy that wins 90% of the time.

You just need to make more from the trades that are already working.

That’s what pyramiding helps you do— Add more only when the market confirms your trade.

This is how serious traders grow their profits.

Not by being perfect. But by pressing harder when it counts.

🟠 Still Have a Doubt? Let’s Solve It Together.

Learning is powerful — but asking the right questions is what turns knowledge into results.

✅ Confused about something you just read?
✅ Not sure how to apply it to your trading journey?

Most traders stay stuck because they never ask. Don’t be one of them.

Ask me directly here — and I’ll personally help you move forward.

Keep Learning