Two Powerful Setups
By Sachin Malik
You can follow every rule in the book, draw every pattern perfectly, and still lose money.
That’s because most traders are focused on the wrong patterns.
They learn the popular ones: Symmetrical Triangles, Wedges, Double Tops, Triple Tops.
Sometimes these patterns work.
Sometimes they don’t.
And that inconsistency drives traders crazy.
You start wondering:
“Is technical analysis even real?”
“Why do some breakouts fly while others fake out?”
You’re not alone. This is the trap 90% of traders fall into.
But here’s the truth: It’s not about the shape of the pattern. It’s about the pressure behind the pattern.
And that pressure comes from just one thing: Institutional Buying.
The best setups in the stock market are the ones that leave behind footprints of big money.
In this article, you’ll learn two such powerful setups:
- VCC — Volatility Contraction Characteristics
- Power Play — The Silent Monster Setup
Both are used by top traders.
Both are signs of strong institutional demand.
And both can put you miles ahead of others who are still chasing textbook patterns.
Let’s dive in.
Part 1. Why Most Chart Patterns Fail Without Fundamentals
Chart patterns alone are not enough.
They may look good on the surface — but if the company behind the chart is weak, the setup will eventually fail.
Here’s the truth:
1.1 A Chart Pattern Is Just Noise If the Business Is Weak
The stock might break out… but it won’t go far.
There’s no real fuel behind the move.
Without strong earnings, a healthy balance sheet, or future growth — there’s no reason for smart money to stay invested.
Price may rise for a few days, but it won’t last.
The chart might look strong — but the business is not.
1.2 Smart Money Only Bets Big When the Fundamentals Are Strong
Institutional investors don’t gamble.
They do deep research.
They look for strong growth, solid financials, and long-term potential.
Only when the fundamentals are convincing — they buy in size.
And only then do powerful patterns appear on the chart.
No strong fundamentals = no big buying = no follow-through.
1.3 Don’t Use These Two Setups Without Fundamental Analysis
The two setups you’re about to learn — VCC and Power Play — are not meant to be used alone.
They are not pure technical patterns.
They are signals.
But signals only work when backed by strong fundamentals.
If you use them blindly, you’ll get trapped.
But when the business is strong, they work beautifully.
You already have the HERO Strategy.
Use it.
Let it filter the noise.
Only trade these setups when both technicals and fundamentals align.
That’s when things really take off.
• Chart patterns only work when the business behind them is strong.
Part 2. What Makes a Setup Powerful?
One word: Urgency.
When institutional investors are in a hurry to buy a stock, that urgency creates something special. It creates a powerful setup.
These investors don’t chase stocks randomly.
They do deep fundamental research — studying the company’s earnings, growth potential, business model, management quality, and competitive edge.
So when they decide to buy, it means something is fundamentally right with the company.
And if they’re in a hurry to buy, that’s a strong signal.
It means the story is strong.
It means the future looks bright.
It means they can’t afford to wait.
And here’s the real magic:
They’re all trying to accumulate large positions — often hundreds of crores worth of shares — and there aren’t enough shares available at lower prices.
So they end up competing with each other. That competition creates buying pressure.
The result?
The stock forms a clean, powerful setup — with tight pullbacks, rising demand, and a breakout that often leads to an explosive move.
So don’t focus on the shape of a chart.
Focus on the story behind it.
If institutions are buying in a hurry, that setup is worth your attention.
Part 3. Setup 1: Volatility Contraction Characteristics (VCC)
Imagine holding a spring in your hand.
You keep pressing it… slowly… carefully.
With every press, it gets tighter.
More pressure builds up.
And then — you let go.
The spring explodes.
That’s exactly how VCC works.
3.1 What is VCC?
VCC stands for Volatility Contraction Characteristics — a setup where a stock makes a series of pullbacks, and each pullback is smaller than the last.
The swings get tighter.
The lows get higher.
Volatility keeps shrinking.
VCC is a sign that buying pressure is increasing, while selling pressure is drying up.
And when the price finally breaks out — it explodes. Just like that spring.
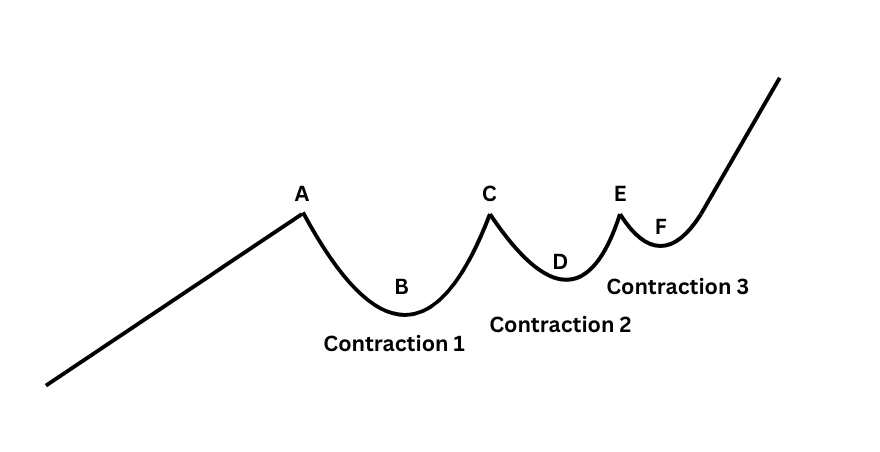
When a stock is trending up, it won’t go straight up forever.
It runs, then rests.
First, it hits Point A — the high.
Then dips to Point B. Rises again to Point C.
Pulls back to Point D — but this time, it doesn’t fall below Point B.
That’s a sign: sellers are getting weaker.
It pushes to Point E. Pulls back to Point F — again, a higher low.
Each dip is smaller than the last. Each bounce tighter. Volatility is drying up.
This is called the Volatility Contraction Characteristics (VCC) setup.
And when it finally breaks out…
Boom.
Momentum explodes.
3.2 Psychology Behind VCC
VCC forms when big players quietly accumulate during an uptrend.
The stock is already moving higher, showing strength.
Then it pulls back, and a few institutions begin building positions — carefully, so they don’t move the price too much.
The price bounces — but the next dip is smaller.
That’s because fewer people are willing to sell their shares.
Other institutions notice this strength and start buying too.
Now supply becomes a problem.
There aren’t enough sellers in the market.
Each pullback gets shallower.
Why?
Because weak hands are mostly out, and strong hands are holding.
The stock begins to tighten — like a spring coiling up — as buyers absorb whatever little supply is left.
This isn’t random.
It’s a clear sign of quiet accumulation.
Institutional demand keeps rising, but available shares are limited.
So price compresses… until the pressure is too much — and it explodes upward.
3.3 How to Identify a VCC
The simplest way to spot a VCC setup is by observing the swing lows.
If each swing low is higher than the previous one, and the swing highs are forming around the same level, you’ve found a VCC.
You don’t need any indicators. Just read the price.
A series of higher swing lows means the stock is coiling — buying pressure is building up.
And when it breaks out, the move is often sharp and decisive.
3.4 Example 1 (KPI Green)
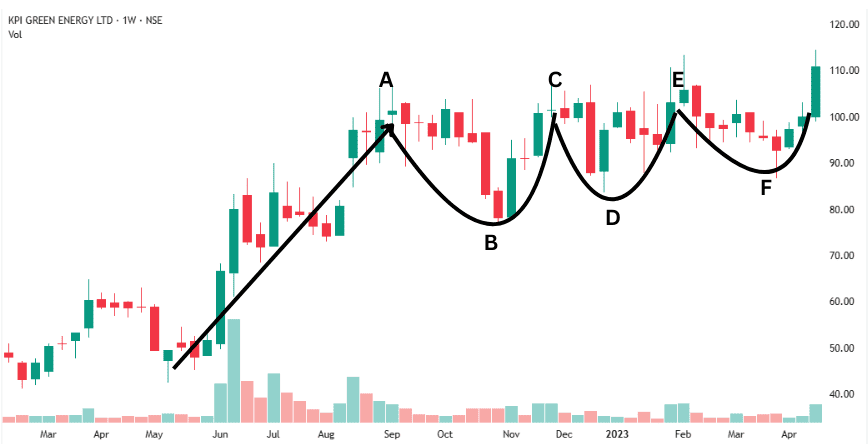
The stock was in an uptrend until Point A, where it pulled back to Point B.
It then rose to Point C and corrected to Point D — but this time, the low stayed above Point B. Volatility started to contract.
Next, it climbed to Point E and pulled back to Point F, which held above Point D. Volatility contracted even further.
This is the Volatility Contraction Characteristics (VCC) setup.
With each pullback, the price swings shrink — a clear sign of tightening action.
VCC setups have some of the highest success rates when they break out.
3.5 Example 2 (IRFC)
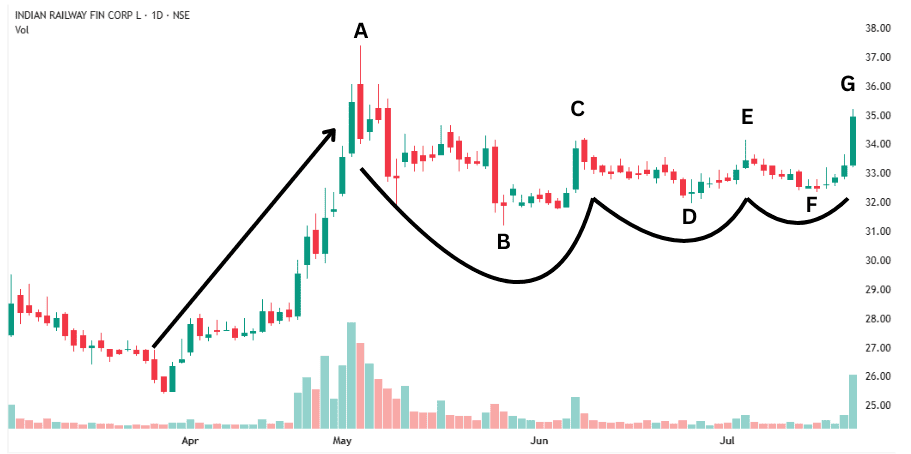
Same setup. Same logic. Same psychology. Everything repeats.
3.6 Why VCC Works So Well
Because it reveals something most people can’t see with the naked eye — institutional buying pressure.
When big investors want to buy hundreds of crores worth of shares, they can’t just hit “buy.”
They need to accumulate slowly.
Quietly.
Strategically.
But there’s a catch — other institutions want to buy too.
So, they start competing.
The stock gets tighter.
Pullbacks shrink.
Eventually, someone blinks and buys aggressively — triggering a breakout.
Others follow.
A chain reaction begins.
That’s why VCCs often lead to explosive moves.
• VCC shows quiet accumulation — pressure building beneath the surface.
3.7 VCC with a Shakeout
Imagine you’re a big investor.
You already own lakhs of shares—but you want more.
The stock is stuck between ₹95 and ₹100.
You know most small traders have stop-losses just below ₹95.
So, what do you do?
You push the stock below ₹95 by selling a small portion.
This triggers panic.
Retail traders dump their shares.
You quietly buy everything at a lower price.
This tactic is called stop-loss hunting.
It clears out weak hands and replaces them with strong ones.
When the stock bounces back and forms a VCC, the breakout becomes even more powerful.
Why?
Because now the stock is backed by strong hands—smart money.
Example 1: Jupiter Wagons Ltd
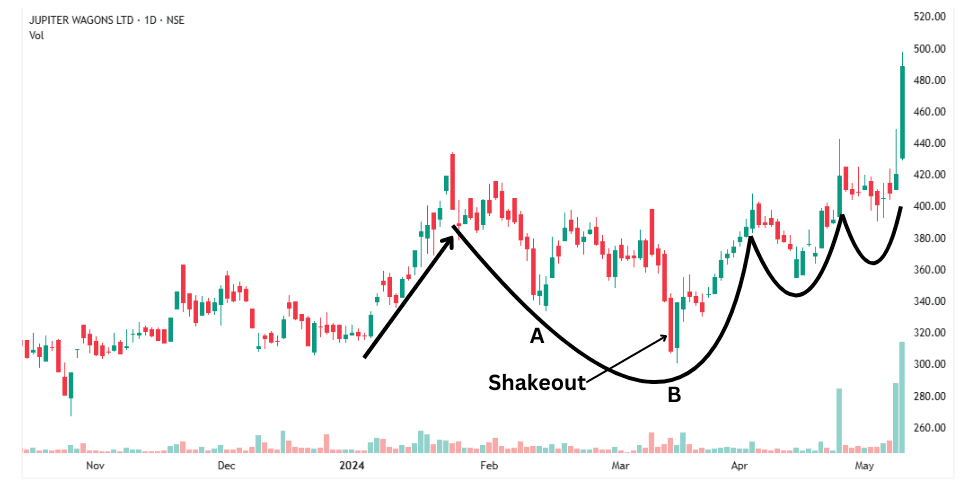
The stock was in an uptrend. It pulled back to Point A, then moved up—only to fall again.
This time, it briefly dropped below Point A. It looked like a breakdown. But then came a sharp bounce from Point B.
That drop was a shakeout.
What followed?
A perfect VCC. Then a strong breakout.
Example 2: TVS motor
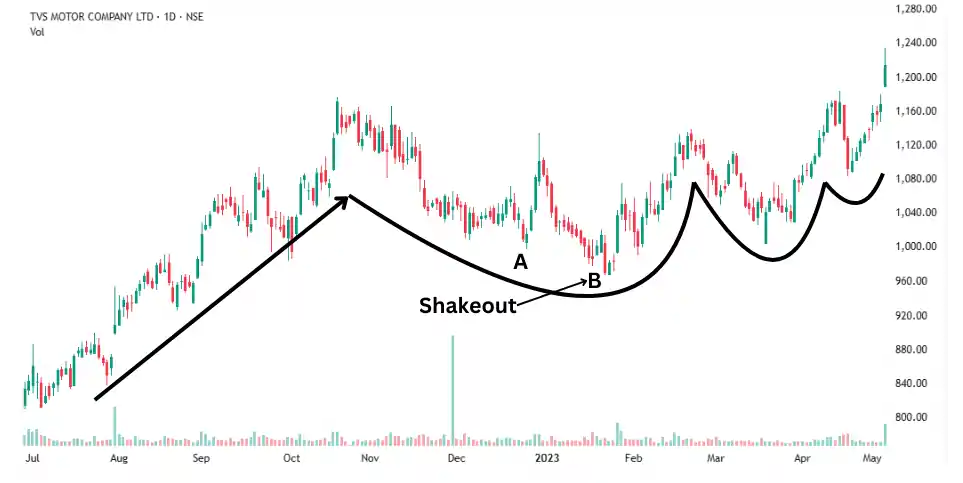
Same shakeout. Same VCC. Same powerful breakout.
A shakeout within VCC makes the setup even stronger. It shows, weak retail hands have been replaced by strong institutional investors.
Part 4. Setup 2: The Power Play Setup
Most traders avoid stocks that have already gone up a lot.
But smart traders know — that’s exactly where the opportunity is.
When a stock doubles or triples in just a few months, and then pauses… something big is happening.
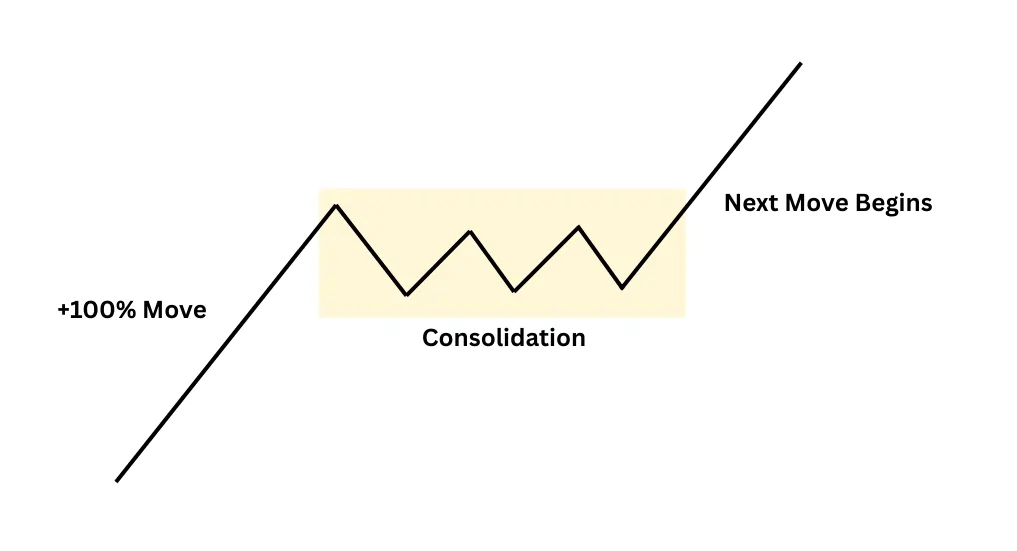
4.1 What is the Power Play Setup?
A Power Play happens when a stock goes on a massive run — 100%, 200%, or more — in a short time, with barely any corrections.
Then, it pauses. Moves sideways. Rests for a bit.
And when it breaks out again —
The next wave begins.
And it often moves even faster than the first.
It’s like a jet on the runway — already at high speed, now refueled and ready for the next lift-off.
The stock rallies over 100% in a near straight line—no major pullbacks.
That kind of move doesn’t happen without strong, urgent buying.
Then it pauses. Goes sideways. Consolidates.
When it breaks out again, a fresh wave often begins.
This is the Power Play Setup.
The breakout often leads to another powerful rally.
4.2 Psychology Behind Power Play Setup
Power Play setups don’t appear out of nowhere.
They form when something fundamentally strong is happening inside the company.
Institutions don’t chase momentum blindly.
They do deep research — earnings, growth triggers, business quality, long-term potential.
When they buy aggressively, it means one thing: They expect strong earnings ahead.
They see profits rising — and they want to buy in early.
This strong, forward-looking buying pressure creates the Power Play setup.
After a sharp rally, the stock doesn’t crash.
It pauses.
Goes sideways.
Tightens up.
That’s not weakness.
It’s quiet accumulation.
Big players are still buying.
But now they’re doing it silently.
When the breakout comes, it’s not random. It’s driven by conviction.
The rally continues — because the story isn’t over.
It’s just getting started.
4.3 How to Identify a Power Play Setup
Here’s what to look for:
- A massive rally (100% + gain in couple of months)
- A tight sideways range afterward — not a deep fall
- A clean breakout from that range
This is your cue.
It tells you: “The first wave is done. Institutions are still buying. The second wave is now starting.”
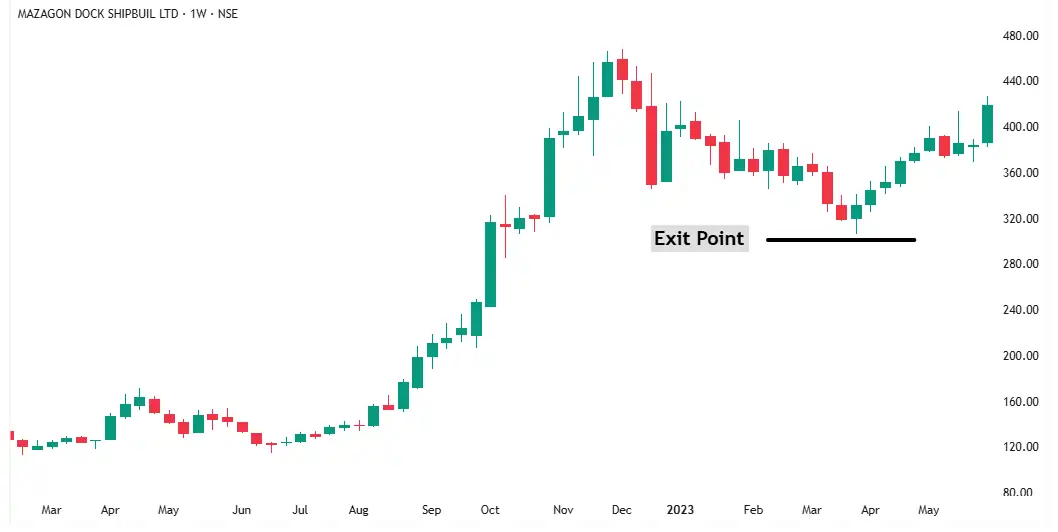
4.4 Example 1 (Mazagon Dock)
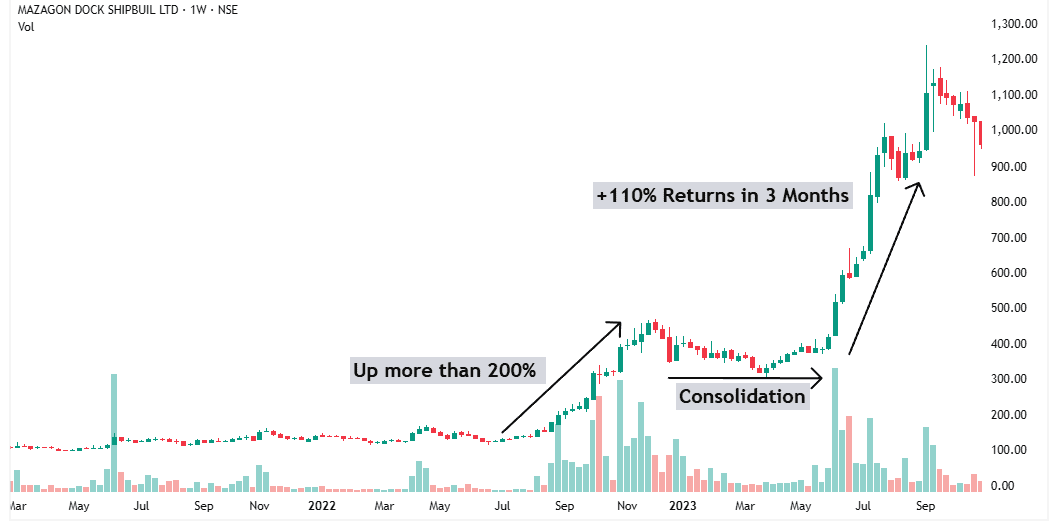
This stock jumped over 200% in just four months.
No major pullbacks. Just a straight-line rally.
That kind of move doesn’t happen by chance.
It happens when the company is doing something very right.
Strong earnings. Strong outlook. Strong buying.
Then the stock paused. It started consolidating.
A healthy break after a strong run.
But fundamentals don’t fade in a few months.
When the story is real, the strength stays.
After the consolidation, the uptrend resumed.
Mazagon Dock doubled again in just three months.
4.5 Example 2 (Aurionpro)
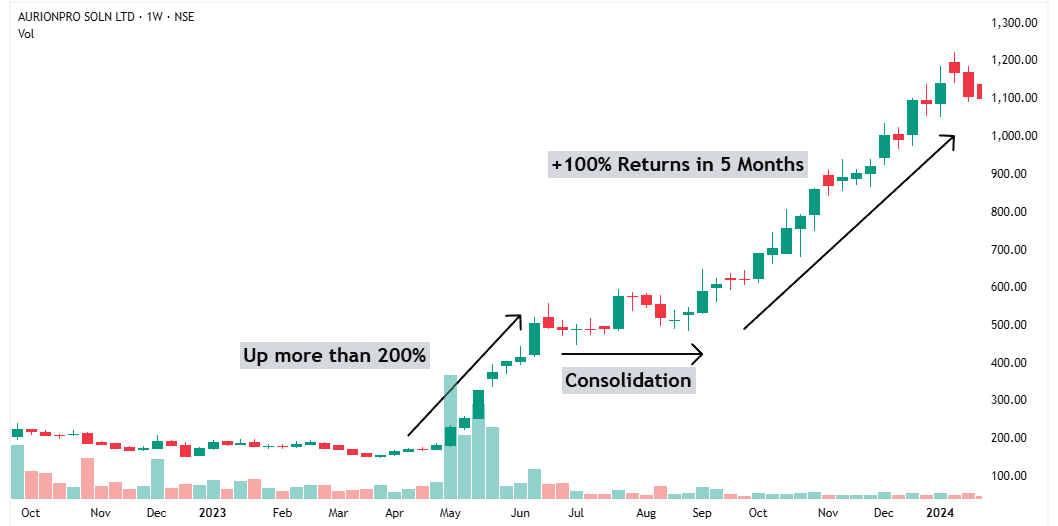
This stock jumped over 200% in just two months — without a single pullback.
That kind of move means institutions were buying aggressively.
Such strength always comes from strong fundamentals.
After the rally, it consolidated for a few months.
Then came the breakout — and it doubled again in five months.
4.6 Why Power Play Works So Well
When a stock jumps more than 100% in a short period of time, it’s not retail traders behind the move.
It means institutional investors are in a hurry.
They’ve done their research.
They know the company is about to grow exceptionally fast — and they don’t want to miss out.
This urgency creates buying pressure.
They accumulate large positions, fast.
And that aggressive buying drives the stock price sharply higher.
But here’s what really powers the move — exceptional earnings growth.
When the company delivers strong results, it confirms their thesis.
More investors step in to buy.
• Power Plays form when institutions buy aggressively and the business still has room to grow.
4.7 Why Most People Miss Power Play Setups
Most people hesitate to buy stocks that have already gone up a lot in a short time.
They look at the price and think, “It’s already moved too much. It can’t go higher.”
So they wait.
And they miss the move.
This mindset kills opportunity.
Because in reality, a rising stock isn’t always expensive. Especially when the company’s earnings are about to grow even faster.
Power Play setups appear when institutions start buying aggressively. They’ve spotted strong fundamentals and they’re not waiting.
The market is just waking up to the story — and the smart money is already getting in.
If you focus too much on where the stock was, you’ll miss where it’s going. In the stock market, what’s going up often keeps going up.
Don’t be afraid of a stock just because the price looks high.
In the HERO Strategy, I’ve already shown you how to judge whether a stock is truly cheap or expensive.
Use that framework.
Don’t let the high-looking price fool you.
Just because a stock has gone up doesn’t mean it’s overvalued.
Part 5. When to Exit If the Trade Goes Wrong
No matter how strong your setup is…
No matter how solid your analysis feels…
Sometimes, trades just don’t work out.
That’s part of the game.
And when things go wrong, the most important question is: When should you exit?
Before I show you the right way to exit, let me start with something most people do — and it’s completely wrong.
In fact, it’s one of the most common mistakes that ruins portfolios.
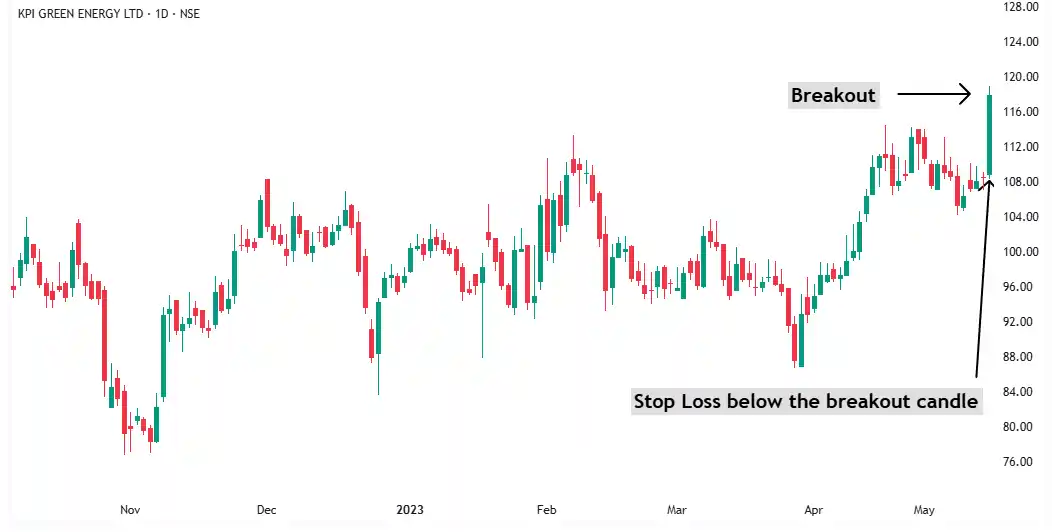
5.1 Wrong Way to Exit: A Stop Loss Just Below the Breakout Candle
This is the most common mistake — and the most expensive one.
You spot the breakout. You enter. You place your stop-loss just below the breakout candle…
Then the stock dips slightly, hits your stop, and reverses.
You’re out.
The stock flies.
You’re left watching.
Why does this happen?
Because everyone uses this strategy — and in the market, what everyone knows rarely works.
If your stop is too tight, you’ll get shaken out by normal price fluctuation.
Example:
Most people do this:
The stock breaks out.
They buy.
Then they place a stop loss just below the low of the breakout candle.
Sounds logical, right?
But it’s a mistake.
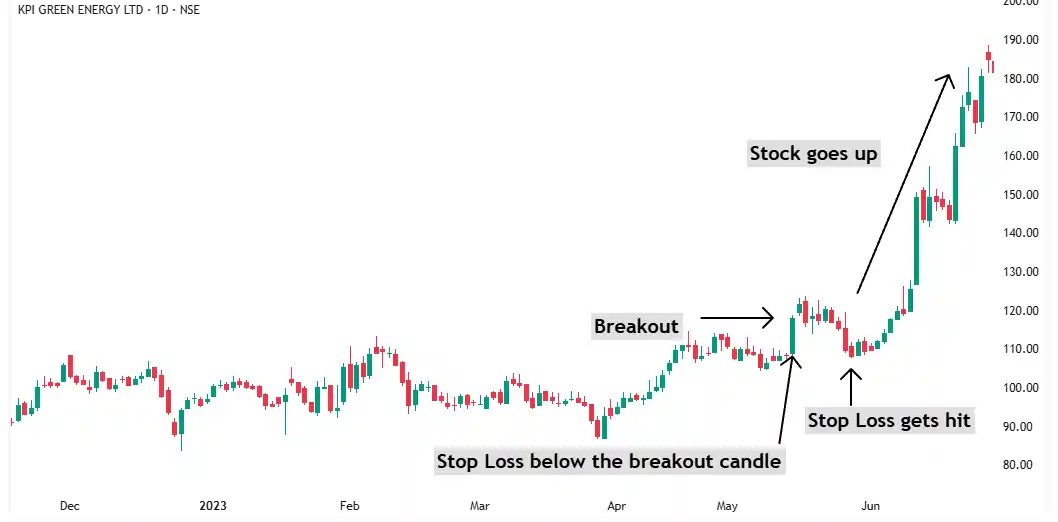
Here’s what usually happens:
The stock pulls back, hits your stop loss… and then goes up.
Without you.
You followed the textbook.
But the textbook didn’t warn you about normal pullbacks in powerful setups.
If your stop loss is too tight, you’ll keep getting kicked out of good trades.
Then you’ll sit there wondering, “Where did I go wrong?”
This approach doesn’t work with VCC or Power Play setups.
They often move fast — but not in a straight line.
Random fluctuations are common.
A tight stop loss might protect your ego.
But it can destroy your trade.
5.2 Right way to set exit Point
When you buy a VCC or Power Play setup, you’re not trading purely on charts.
You’re combining fundamentals and technicals using the HERO Strategy.
So your exit plan must reflect that.
You can’t exit just because of a candlestick pattern or a price dip.
You exit only when your fundamental view goes wrong.
When the story breaks.
When the data no longer supports the trade.
That’s why your exit point must be far below your entry.
Your exit point should only trigger if something fundamentally goes wrong in the business.
Here’s a simple rule of thumb:
- VCC setups: Exit below the lowest swing low of the entire pattern
- Power Play setups: Exit below the bottom of the consolidation zone
This isn’t a stop-loss you place with your broker.
It’s a mental exit level — something I’ve figured out through years of trading.
And you don’t react on intraday moves.
You act only if the stock closes below that level on the weekly chart.
This keeps you in while the trade is working…
And gets you out only when it’s really over.
Example 1: Mazdock
Example 2: Macfos

• Exit only when the fundamentals break — not when the price wobbles.
Conclusion: Follow the Smart Money
VCC and Power Play aren’t just patterns — they’re signs of institutional urgency.
But they only work when the fundamentals support the move.
Spot the setup — whether it’s a VCC or a Power Play.
Use the HERO Strategy to find the story behind the chart.
And ride the wave with confidence — backed by real money.
No guessing.
No chasing.
Just high-probability trades with real conviction.
🟠 Still Have a Doubt? Let’s Solve It Together.
Learning is powerful — but asking the right questions is what turns knowledge into results.
 Confused about something you just read? Not sure how to apply it to your trading journey?
Most traders stay stuck because they never ask. Don’t be one of them.
Ask me directly here — and I’ll personally help you move forward.
Keep Learning
Next Lesson: Fundamental Analysis